
User's Manual
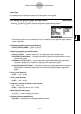
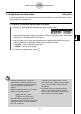
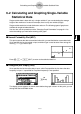
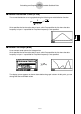
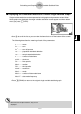
Table Of Contents
- Quick-Start
- Precautions when Using this Product
- Contents
- Getting Acquainted— Read This First!
- Chapter 1 Basic Operation
- Chapter 2 Manual Calculations
- Chapter 3 List Function
- Chapter 4 Equation Calculations
- Chapter 5 Graphing
- 5-1 Sample Graphs
- 5-2 Controlling What Appears on a Graph Screen
- 5-3 Drawing a Graph
- 5-4 Storing a Graph in Picture Memory
- 5-5 Drawing Two Graphs on the Same Screen
- 5-6 Manual Graphing
- 5-7 Using Tables
- 5-8 Dynamic Graphing
- 5-9 Graphing a Recursion Formula
- 5-10 Changing the Appearance of a Graph
- 5-11 Function Analysis
- Chapter 6 Statistical Graphs and Calculations
- Chapter 7 Financial Calculation (TVM)
- Chapter 8 Programming
- Chapter 9 Spreadsheet
- Chapter 10 eActivity
- Chapter 11 System Settings Menu
- Chapter 12 Data Communications
- Appendix
20070201
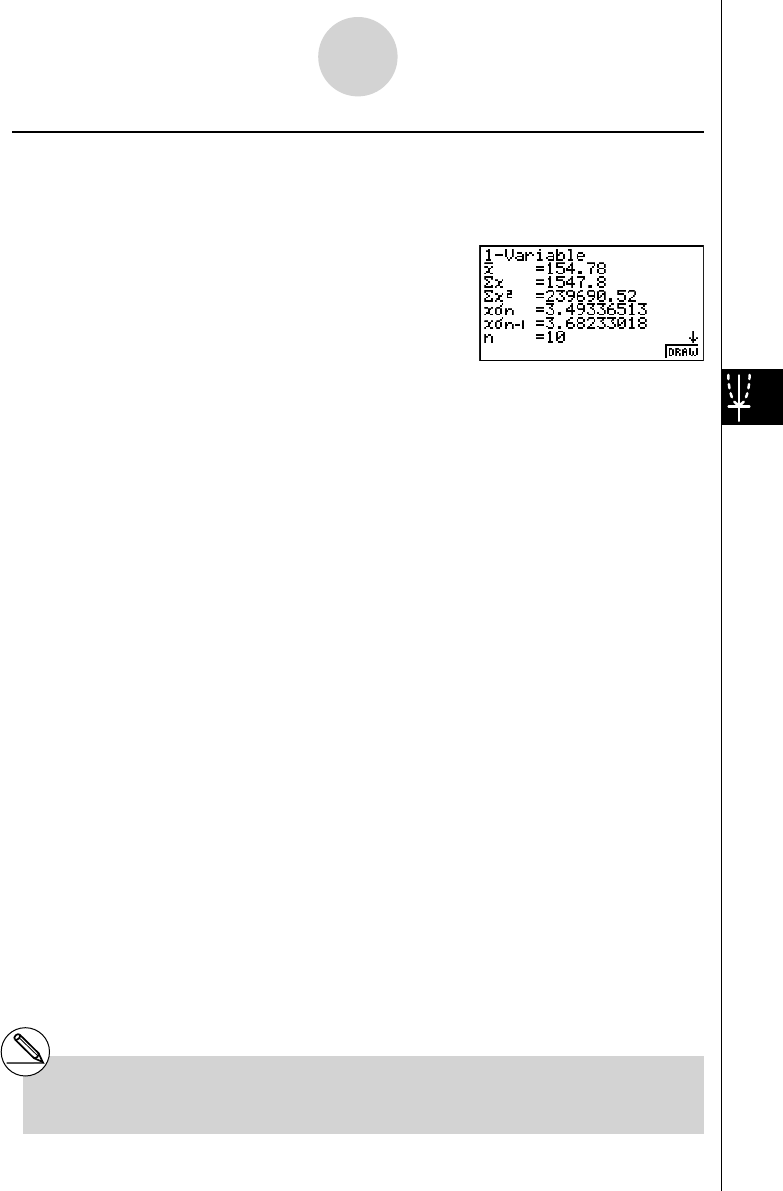
k Displaying the Calculation Results of a Drawn Single-Variable Graph
Single-variable statistics can be expressed as both graphs and parameter values. When
these graphs are displayed, the single-variable calculation results appear as shown below
when you press 1 (1VAR).
• Use c to scroll the list so you can view the items that run off the bottom of the screen.
The following describes the meaning of each of the parameters.
¯ x .............. mean
Σ
x ............ sum
Σ
x
2
.......... sum of squares
x σ n .......... population standard deviation
x σ n –1 ........ sample standard deviation
n ..............number of data items
minX ........minimum
Q1 ............ fi rst quartile
Med.......... median
Q3 ............ third quartile
maxX ....... maximum
Mod.......... mode
Mod :
n ....number of data mode items
Mod : F ....data mode frequency
• Press 6 (DRAW) to return to the original single-variable statistical graph.
6-2-4
Calculating and Graphing Single-Variable Statistical Data
# When Mod has multiple solutions, they are all
displayed.