
User's Manual
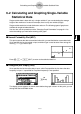
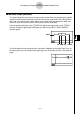
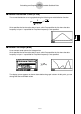
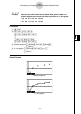
Table Of Contents
- Quick-Start
- Precautions when Using this Product
- Contents
- Getting Acquainted— Read This First!
- Chapter 1 Basic Operation
- Chapter 2 Manual Calculations
- Chapter 3 List Function
- Chapter 4 Equation Calculations
- Chapter 5 Graphing
- 5-1 Sample Graphs
- 5-2 Controlling What Appears on a Graph Screen
- 5-3 Drawing a Graph
- 5-4 Storing a Graph in Picture Memory
- 5-5 Drawing Two Graphs on the Same Screen
- 5-6 Manual Graphing
- 5-7 Using Tables
- 5-8 Dynamic Graphing
- 5-9 Graphing a Recursion Formula
- 5-10 Changing the Appearance of a Graph
- 5-11 Function Analysis
- Chapter 6 Statistical Graphs and Calculations
- Chapter 7 Financial Calculation (TVM)
- Chapter 8 Programming
- Chapter 9 Spreadsheet
- Chapter 10 eActivity
- Chapter 11 System Settings Menu
- Chapter 12 Data Communications
- Appendix
20070201
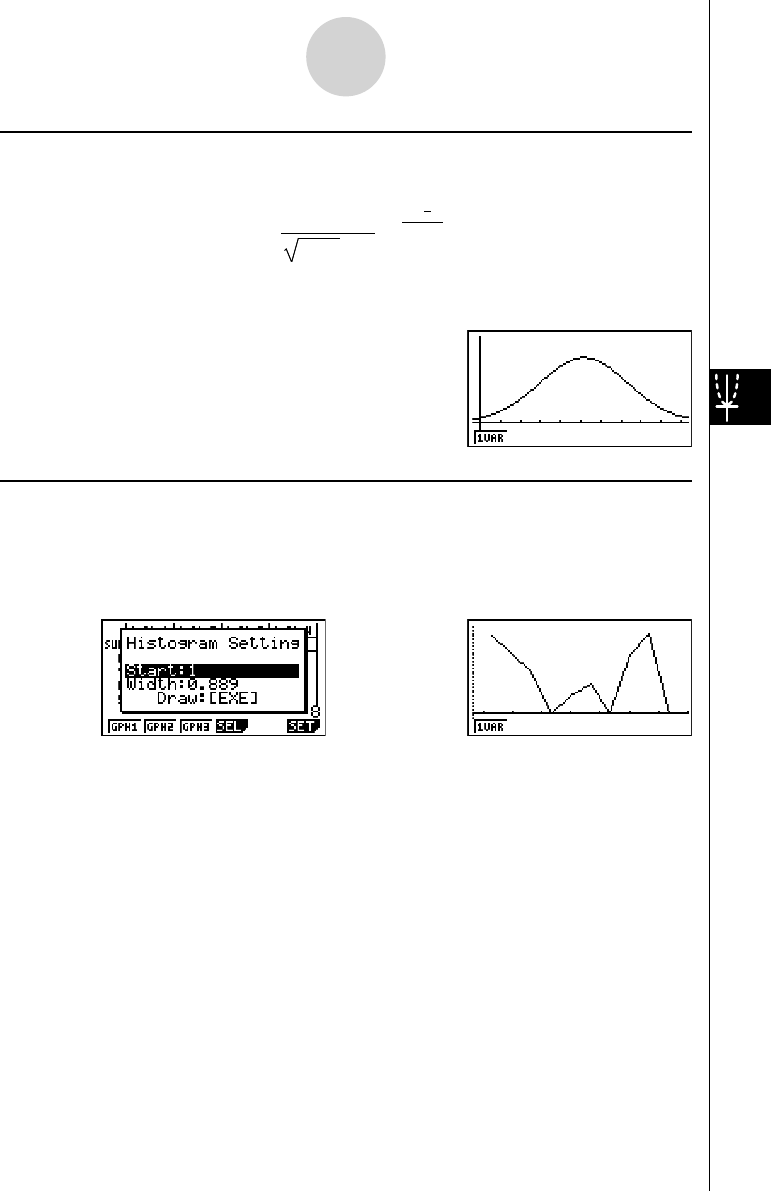
k Normal Distribution Curve (N
•
Dis)
The normal distribution curve is graphed using the following normal distribution function.
XList specifi es the list where the data is input, while Freq specifi es the list where the data
frequency is input. 1 is specifi ed for Freq when frequency is not specifi ed.
k Broken Line Graph (Brkn)
Lines connect center points of a histogram bar.
XList specifi es the list where the data is input, while Freq specifi es the list where the data
frequency is input. 1 is specifi ed for Freq when frequency is not specifi ed.
w (Draw)
The display screen appears as shown above before the graph is drawn. At this point, you can
change the Start and Width values.
y
=
1
(2 π) xσn
e
–
2xσ
n
2
(
x–
x
)
2
y
=
1
(2 π) xσn
e
–
2xσ
n
2
(
x–
x
)
2
⇒⇒
6-2-3
Calculating and Graphing Single-Variable Statistical Data