
User's Manual
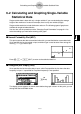
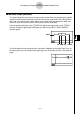
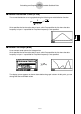
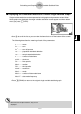
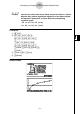
Table Of Contents
- Quick-Start
- Precautions when Using this Product
- Contents
- Getting Acquainted— Read This First!
- Chapter 1 Basic Operation
- Chapter 2 Manual Calculations
- Chapter 3 List Function
- Chapter 4 Equation Calculations
- Chapter 5 Graphing
- 5-1 Sample Graphs
- 5-2 Controlling What Appears on a Graph Screen
- 5-3 Drawing a Graph
- 5-4 Storing a Graph in Picture Memory
- 5-5 Drawing Two Graphs on the Same Screen
- 5-6 Manual Graphing
- 5-7 Using Tables
- 5-8 Dynamic Graphing
- 5-9 Graphing a Recursion Formula
- 5-10 Changing the Appearance of a Graph
- 5-11 Function Analysis
- Chapter 6 Statistical Graphs and Calculations
- Chapter 7 Financial Calculation (TVM)
- Chapter 8 Programming
- Chapter 9 Spreadsheet
- Chapter 10 eActivity
- Chapter 11 System Settings Menu
- Chapter 12 Data Communications
- Appendix
20070201
k Med-box Graph (MedBox)
This type of graph lets you see how a large number of data items are grouped within specifi c
ranges. A box encloses all the data in an area from the fi rst quartile (Q1) to the third quartile
(Q3), with a line drawn at the median (Med). Lines (called whiskers) extend from either end
of the box up to the minimum (minX) and maximum (maxX) of the data.
From the statistical data list, press 1 (GRPH) to display the graph menu, press 6 (SET),
and then change the graph type of the graph you want to use (GPH1, GPH2, GPH3) to
med-box graph.
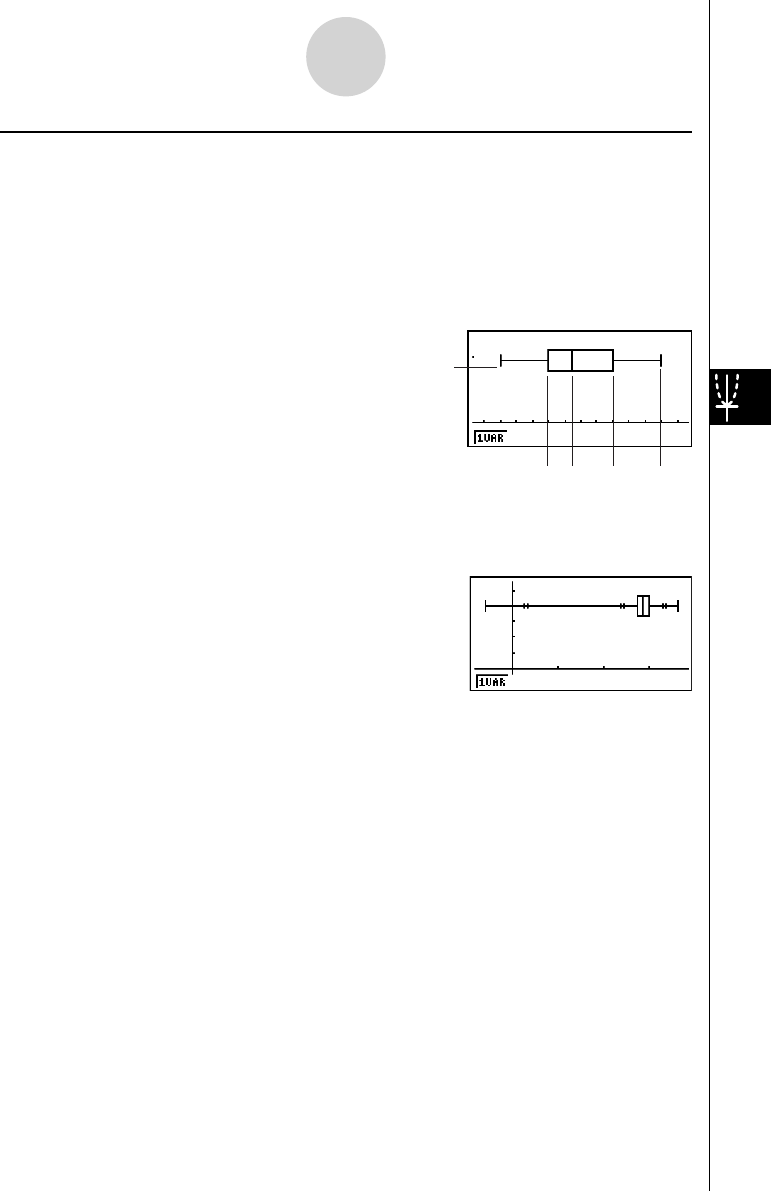
To plot the data that falls outside the box, fi rst specify “MedBox” as the Graph Type. Then, on
the same screen you use to specify the graph type, turn the Outliers item “On”, and draw the
graph.
minX
MedQ1 Q3 maxX
minX
MedQ1 Q3 maxX
6-2-2
Calculating and Graphing Single-Variable Statistical Data