
User's Manual
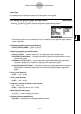
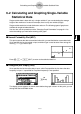
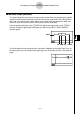
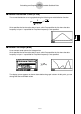
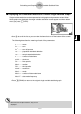
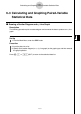
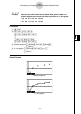
Table Of Contents
- Quick-Start
- Precautions when Using this Product
- Contents
- Getting Acquainted— Read This First!
- Chapter 1 Basic Operation
- Chapter 2 Manual Calculations
- Chapter 3 List Function
- Chapter 4 Equation Calculations
- Chapter 5 Graphing
- 5-1 Sample Graphs
- 5-2 Controlling What Appears on a Graph Screen
- 5-3 Drawing a Graph
- 5-4 Storing a Graph in Picture Memory
- 5-5 Drawing Two Graphs on the Same Screen
- 5-6 Manual Graphing
- 5-7 Using Tables
- 5-8 Dynamic Graphing
- 5-9 Graphing a Recursion Formula
- 5-10 Changing the Appearance of a Graph
- 5-11 Function Analysis
- Chapter 6 Statistical Graphs and Calculations
- Chapter 7 Financial Calculation (TVM)
- Chapter 8 Programming
- Chapter 9 Spreadsheet
- Chapter 10 eActivity
- Chapter 11 System Settings Menu
- Chapter 12 Data Communications
- Appendix
20070201
6-2 Calculating and Graphing Single-Variable
Statistical Data
Single-variable data is data with only a single variable. If you are calculating the average
height of the members of a class for example, there is only one variable (height).
Single-variable statistics include distribution and sum. The following types of graphs are
available for single-variable statistics.
You can also use the procedures under “Changing Graph Parameters” on page 6-1-2 to
make the settings you want before drawing each graph.
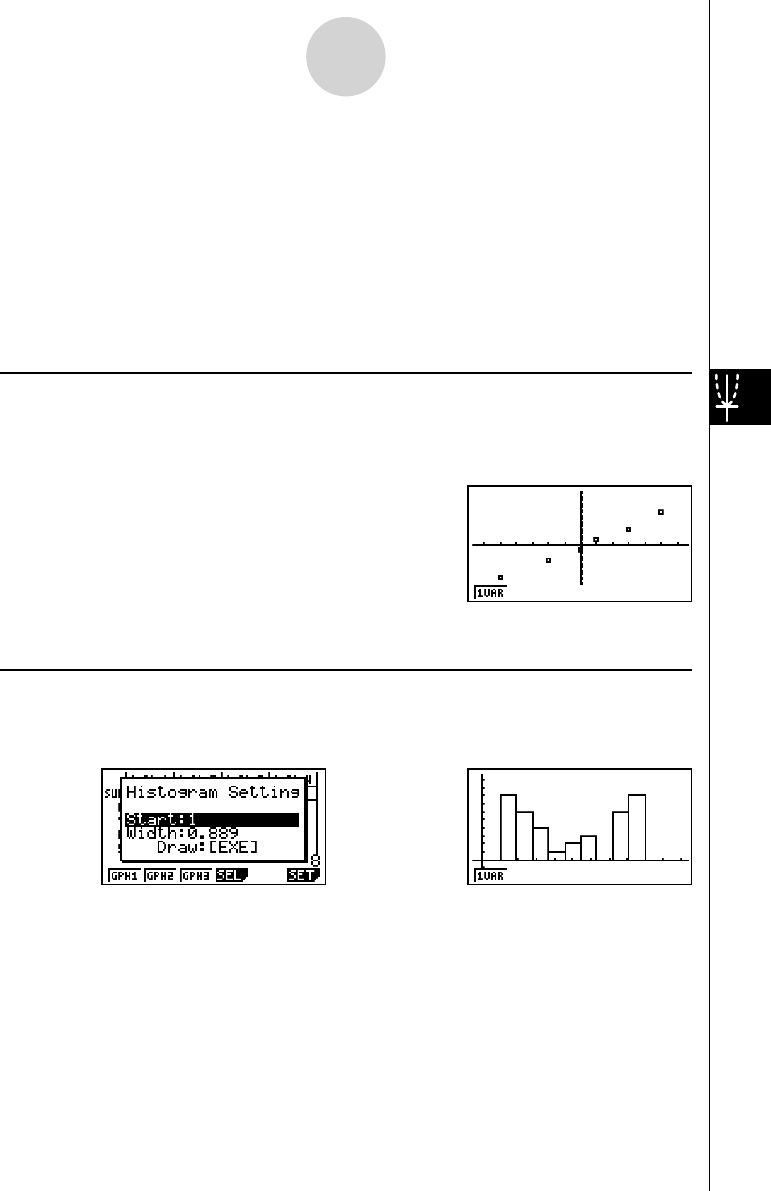
k Normal Probability Plot (NPP)
This plot compares the data accumulated ratio with a normal distribution accumulated ratio.
XList specifi es the list where data is input, and Mark Type is used to select from among the
marks { / × / • }you want to plot.
Press A , J or !J (QUIT) to return to the statistical data list.
k Histogram ( Bar Graph) (Hist)
XList specifi es the list where the data is input, while Freq specifi es the list where the data
frequency is input. 1 is specifi ed for Freq when frequency is not specifi ed.
w (Draw)
The display screen appears as shown above before the graph is drawn. At this point, you can
change the Start and Width values.
⇒⇒
6-2-1
Calculating and Graphing Single-Variable Statistical Data