
User's Manual
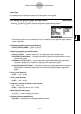
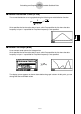
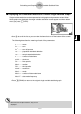
Table Of Contents
- Quick-Start
- Precautions when Using this Product
- Contents
- Getting Acquainted— Read This First!
- Chapter 1 Basic Operation
- Chapter 2 Manual Calculations
- Chapter 3 List Function
- Chapter 4 Equation Calculations
- Chapter 5 Graphing
- 5-1 Sample Graphs
- 5-2 Controlling What Appears on a Graph Screen
- 5-3 Drawing a Graph
- 5-4 Storing a Graph in Picture Memory
- 5-5 Drawing Two Graphs on the Same Screen
- 5-6 Manual Graphing
- 5-7 Using Tables
- 5-8 Dynamic Graphing
- 5-9 Graphing a Recursion Formula
- 5-10 Changing the Appearance of a Graph
- 5-11 Function Analysis
- Chapter 6 Statistical Graphs and Calculations
- Chapter 7 Financial Calculation (TVM)
- Chapter 8 Programming
- Chapter 9 Spreadsheet
- Chapter 10 eActivity
- Chapter 11 System Settings Menu
- Chapter 12 Data Communications
- Appendix
20070201
• Mark Type
This setting lets you specify the shape of the plot points on the graph.
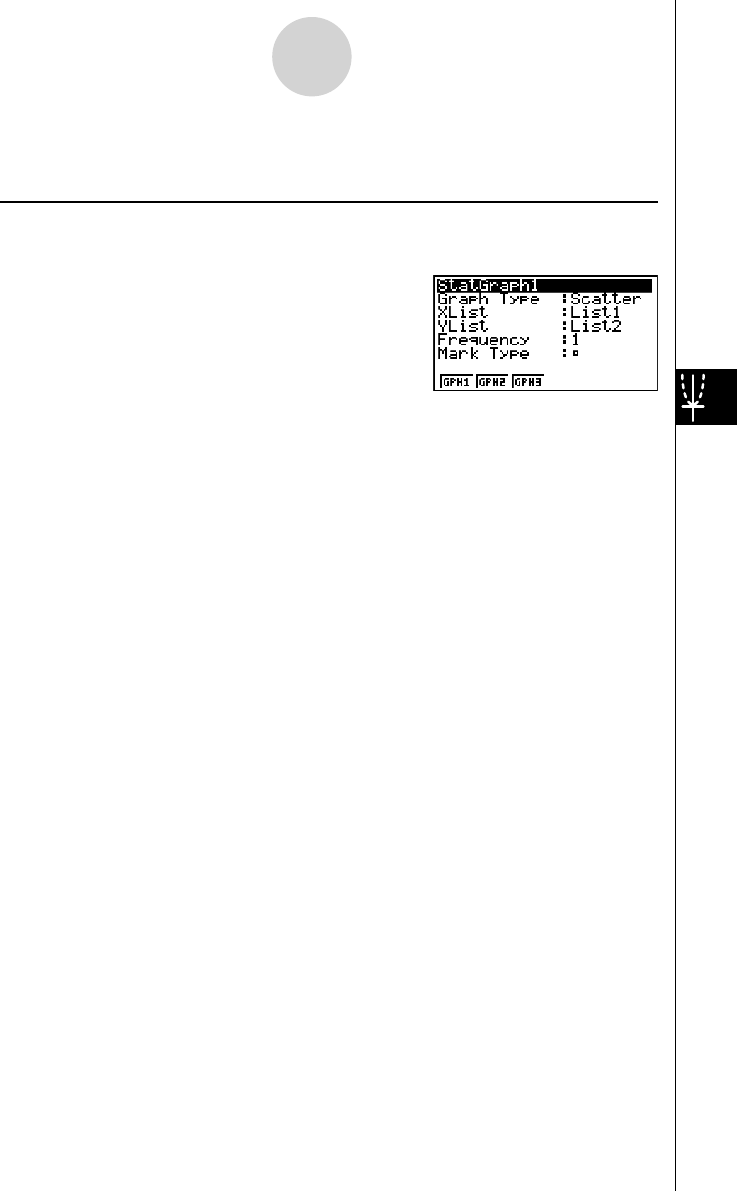
u To display the general graph settings screen [GRPH]-[SET]
Pressing 1 (GRPH)6 (SET) displays the general graph settings screen.
• The settings shown here are examples only. The settings on your general graph settings
screen may differ.
• StatGraph (statistical graph specifi cation)
• { GPH1 } / { GPH2 } / { GPH3 } ... graph {1}/{2}/{3}
• Graph Type (graph type specifi cation)
• { Scat } / {
xy } / { NPP } ... {scatter diagram}/{ xy line graph}/{normal probability plot}
• { Hist } / { Box } / { N·Dis } / { Brkn } ... {histogram}/{med-box graph}/{normal distribution curve}/
{broken line graph}
• { X } / { Med } / { X^2 } / { X^3 } / { X^4 } ... {linear regression graph}/{Med-Med graph}/{quadratic
regression graph}/{cubic regression graph}/{quartic regression graph}
• { Log } / { Exp } / { Pwr } / { Sin } / { Lgst } ... {logarithmic regression graph}/{exponential regression
graph}/{power regression graph}/{sinusoidal regression graph}/{logistic regression
graph}
• XList ( x -axis data list)
• { LIST } ... {List 1 to 26}
• YList ( y -axis data list)
• { LIST } ... {List 1 to 26}
• Frequency (number of times a value occurs)
• { 1 } ... {1-to-1 plot}
• { LIST } ... frequency data in {List 1 to 26}
• Mark Type (plot mark type)
• { } / { × } / { • } ... scatter diagram plot points
• Outliers (outliers specifi cation)
• { On } / { Off } ... {display}/{do not display} Med-Box outliers
6-1-3
Before Performing Statistical Calculations