
User's Manual
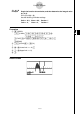
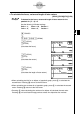
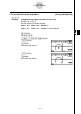

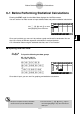
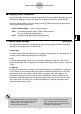
Table Of Contents
- Quick-Start
- Precautions when Using this Product
- Contents
- Getting Acquainted— Read This First!
- Chapter 1 Basic Operation
- Chapter 2 Manual Calculations
- Chapter 3 List Function
- Chapter 4 Equation Calculations
- Chapter 5 Graphing
- 5-1 Sample Graphs
- 5-2 Controlling What Appears on a Graph Screen
- 5-3 Drawing a Graph
- 5-4 Storing a Graph in Picture Memory
- 5-5 Drawing Two Graphs on the Same Screen
- 5-6 Manual Graphing
- 5-7 Using Tables
- 5-8 Dynamic Graphing
- 5-9 Graphing a Recursion Formula
- 5-10 Changing the Appearance of a Graph
- 5-11 Function Analysis
- Chapter 6 Statistical Graphs and Calculations
- Chapter 7 Financial Calculation (TVM)
- Chapter 8 Programming
- Chapter 9 Spreadsheet
- Chapter 10 eActivity
- Chapter 11 System Settings Menu
- Chapter 12 Data Communications
- Appendix
20070201
6-1 Before Performing Statistical Calculations
Entering the STAT mode from the Main Menu displays the List Editor screen.
You can use the List Editor screen to input statistical data and perform statistical calculations.
Use f , c , d and e to move
the highlighting around the lists.
Once you input data, you can use it to produce a graph and check for tendencies. You can
also use a variety of different regression calculations to analyze the data.
• For information about using the statistical data lists, see “3. List Function”.
k Inputting Data into Lists
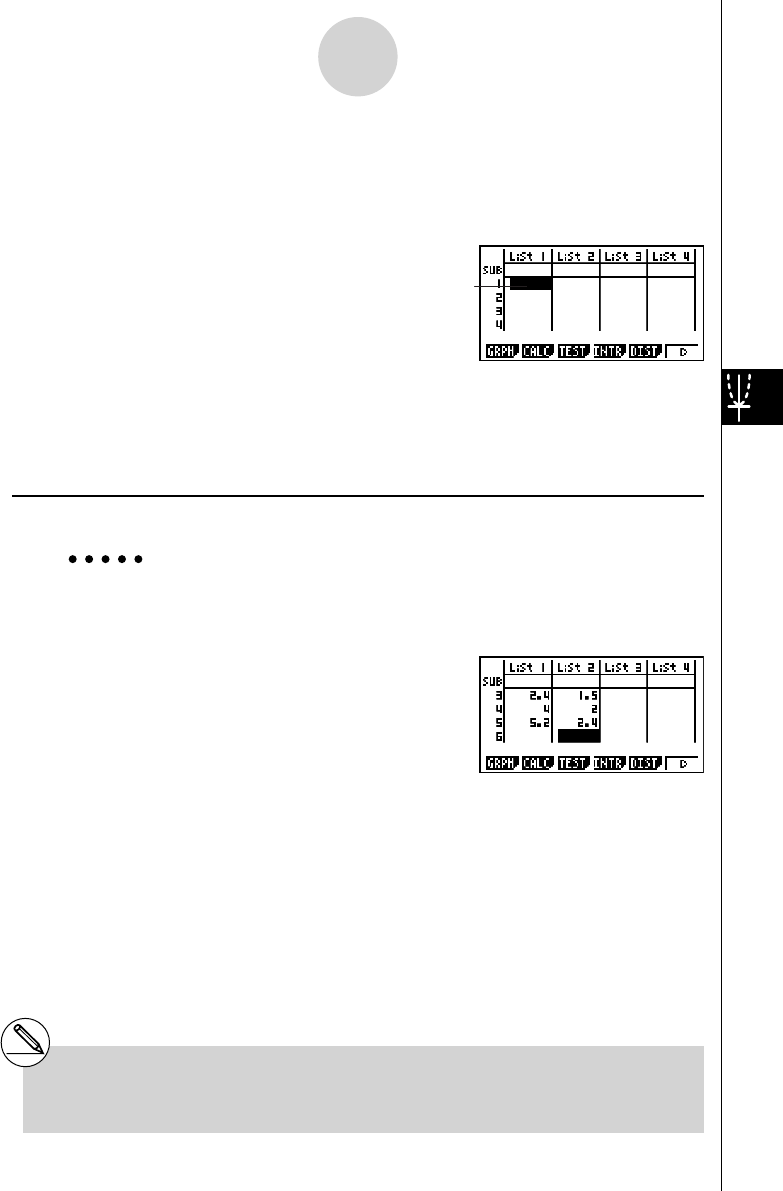
Example To input the following two data groups
0.5, 1.2, 2.4, 4.0, 5.2
–2.1, 0.3, 1.5, 2.0, 2.4
a.fwb.cw
c.ewewf.cw
e
-c.bwa.dw
b.fwcwc.ew
Once data is input, you can use it for graphing and statistical calculations.
6-1-1
Before Performing Statistical Calculations
# Except for complex numbers, calculation
results can be input as statistical data.
# You can use the f , c , d and e keys to
move the highlighting to any cell in the lists for
data input.