
User's Manual

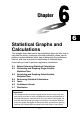
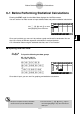
Table Of Contents
- Quick-Start
- Precautions when Using this Product
- Contents
- Getting Acquainted— Read This First!
- Chapter 1 Basic Operation
- Chapter 2 Manual Calculations
- Chapter 3 List Function
- Chapter 4 Equation Calculations
- Chapter 5 Graphing
- 5-1 Sample Graphs
- 5-2 Controlling What Appears on a Graph Screen
- 5-3 Drawing a Graph
- 5-4 Storing a Graph in Picture Memory
- 5-5 Drawing Two Graphs on the Same Screen
- 5-6 Manual Graphing
- 5-7 Using Tables
- 5-8 Dynamic Graphing
- 5-9 Graphing a Recursion Formula
- 5-10 Changing the Appearance of a Graph
- 5-11 Function Analysis
- Chapter 6 Statistical Graphs and Calculations
- Chapter 7 Financial Calculation (TVM)
- Chapter 8 Programming
- Chapter 9 Spreadsheet
- Chapter 10 eActivity
- Chapter 11 System Settings Menu
- Chapter 12 Data Communications
- Appendix
20070201
Statistical Graphs and
Calculations
This chapter describes how to input statistical data into lists, how to
calculate the mean, maximum and other statistical values, how to
perform various statistical tests, how to determine the confi dence
interval, and how to produce a distribution of statistical data.
It also tells you how to perform regression calculations.
6-1 Before Performing Statistical Calculations
6-2 Calculating and Graphing Single-Variable
Statistical Data
6-3 Calculating and Graphing Paired-Variable
Statistical Data
6-4 Performing Statistical Calculations
6-5 Tests
6-6 Confi dence Interval
6-7 Distribution
Important!
• This chapter contains a number of graph screen shots. In each case, new
data values were input in order to highlight the particular characteristics of
the graph being drawn. Note that when you try to draw a similar graph, the
unit uses data values that you have input using the List function. Because
of this, the graphs that appear on the screen when you perform a graphing
operation will probably differ somewhat from those shown in this manual.
6
Chapter