
User's Manual
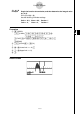
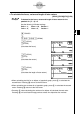
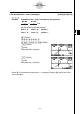
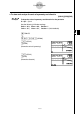

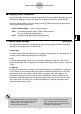
Table Of Contents
- Quick-Start
- Precautions when Using this Product
- Contents
- Getting Acquainted— Read This First!
- Chapter 1 Basic Operation
- Chapter 2 Manual Calculations
- Chapter 3 List Function
- Chapter 4 Equation Calculations
- Chapter 5 Graphing
- 5-1 Sample Graphs
- 5-2 Controlling What Appears on a Graph Screen
- 5-3 Drawing a Graph
- 5-4 Storing a Graph in Picture Memory
- 5-5 Drawing Two Graphs on the Same Screen
- 5-6 Manual Graphing
- 5-7 Using Tables
- 5-8 Dynamic Graphing
- 5-9 Graphing a Recursion Formula
- 5-10 Changing the Appearance of a Graph
- 5-11 Function Analysis
- Chapter 6 Statistical Graphs and Calculations
- Chapter 7 Financial Calculation (TVM)
- Chapter 8 Programming
- Chapter 9 Spreadsheet
- Chapter 10 eActivity
- Chapter 11 System Settings Menu
- Chapter 12 Data Communications
- Appendix
20070201
u To draw and analyze the asymptotes [G-SLV]-[ASYM]
Example To draw the asymptotes for the hyperbola
Use the following V-Window settings.
Xmin = –6.3, Xmax = 6.3, Xscale = 1
Ymin = –5, Ymax = 5, Yscale = 1
m CONICS
ccccccc w
c w c w b w b w6 (DRAW)
!5 (G-SLV)
5 (ASYM)
(Draws the asymptotes.)
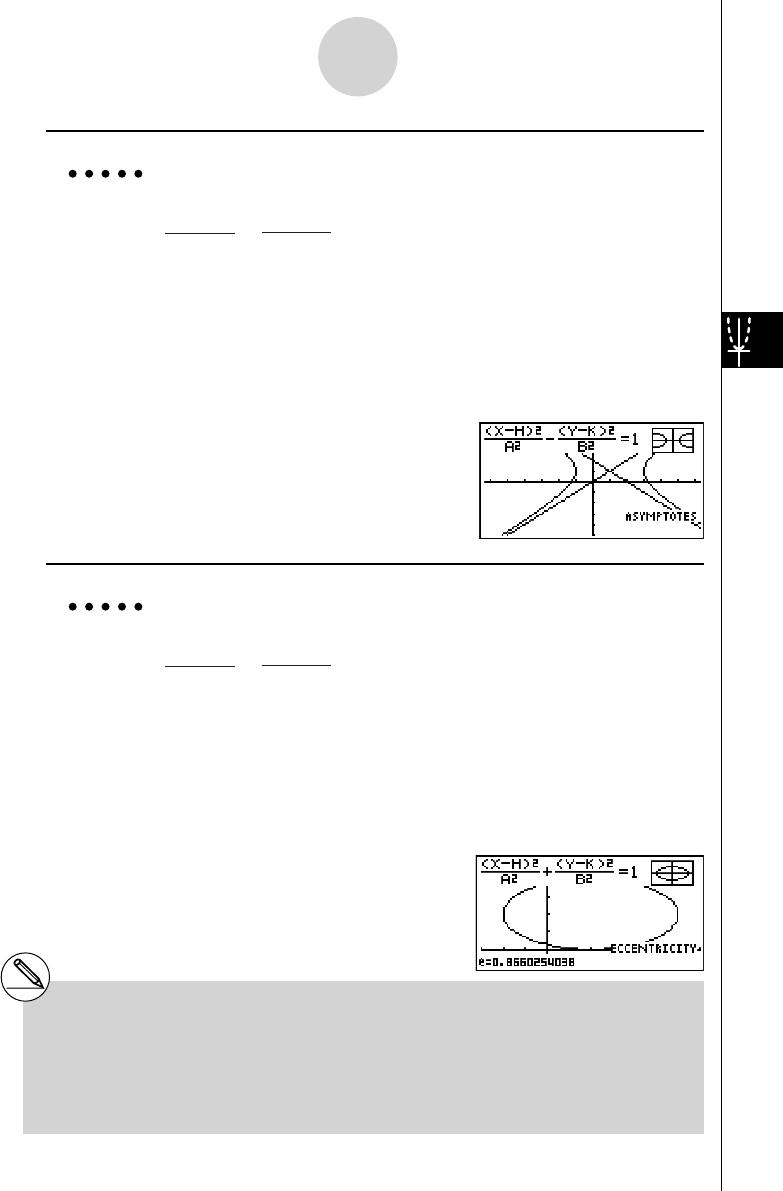
u To calculate eccentricity [G-SLV]-[e]
Example To determine the eccentricity of the graph for ellipse
Use the following V-Window settings.
Xmin = –3, Xmax = 7, Xscale = 1
Ymin = –1, Ymax = 5, Yscale = 1
m CONICS
cccccc w
e w c w c w c w6 (DRAW)
!5 (G-SLV)
6 (g )1 (e)
(Calculates eccentricity.)
(X – 1)
2
–
(Y – 1)
2
= 1
2
2
2
2
(X – 1)
2
–
(Y – 1)
2
= 1
2
2
2
2
(X – 2)
2
+
(Y – 2)
2
= 1
4
2
2
2
(X – 2)
2
+
(Y – 2)
2
= 1
4
2
2
2
# Certain V-Window parameters can produce
errors in values produced as graph analysis
results.
# The message ”Not Found” appears on the
display when graph analysis is unable to
produce a result.
# The following can result in inaccurate analysis
results or may even make it impossible to obtain a
solution at all.
- When the solution is tangent to the
x -axis.
- When the solution is a point of tangency
between two graphs.
5-11-22
Function Analysis