
User's Manual
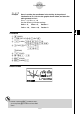
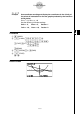
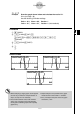
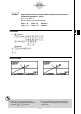
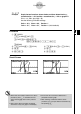
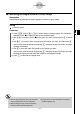
Table Of Contents
- Quick-Start
- Precautions when Using this Product
- Contents
- Getting Acquainted— Read This First!
- Chapter 1 Basic Operation
- Chapter 2 Manual Calculations
- Chapter 3 List Function
- Chapter 4 Equation Calculations
- Chapter 5 Graphing
- 5-1 Sample Graphs
- 5-2 Controlling What Appears on a Graph Screen
- 5-3 Drawing a Graph
- 5-4 Storing a Graph in Picture Memory
- 5-5 Drawing Two Graphs on the Same Screen
- 5-6 Manual Graphing
- 5-7 Using Tables
- 5-8 Dynamic Graphing
- 5-9 Graphing a Recursion Formula
- 5-10 Changing the Appearance of a Graph
- 5-11 Function Analysis
- Chapter 6 Statistical Graphs and Calculations
- Chapter 7 Financial Calculation (TVM)
- Chapter 8 Programming
- Chapter 9 Spreadsheet
- Chapter 10 eActivity
- Chapter 11 System Settings Menu
- Chapter 12 Data Communications
- Appendix
20070201
Example Draw the graph shown below and calculate the root for Y1.
Y1 =
x ( x + 2)( x – 2)
Use the following V-Window settings.
Xmin = –6.3, Xmax = 6.3, Xscale = 1
Ymin = –3.1, Ymax = 3.1, Yscale = 1 (initial defaults)
Procedure
1 m GRAPH
2 !3 (V-WIN)1 (INIT)J
3 (TYPE)1 (Y=)v ( v +c)( v -c) w
6 (DRAW)
3 !5 (G-SLV)1 (ROOT)
5 e
e
Result Screen
……
5-11-10
Function Analysis
# When analyzing a single graph, results appear
as soon as you select an analysis function in
step 3, so step 4 is not necessary.
# Root, local maximum value, local minimum
value, and y -intercept can be calculated for
rectangular coordinate graphs and inequality
graphs only.
# Graph analysis is not possible for the graph
whose function is the format X = constant.
# The
y -intercept is the point where the graph
crosses the y -axis.