
User's Manual
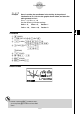
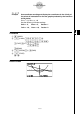
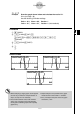
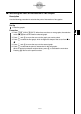
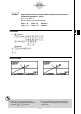
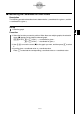
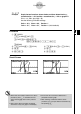
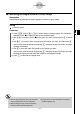
Table Of Contents
- Quick-Start
- Precautions when Using this Product
- Contents
- Getting Acquainted— Read This First!
- Chapter 1 Basic Operation
- Chapter 2 Manual Calculations
- Chapter 3 List Function
- Chapter 4 Equation Calculations
- Chapter 5 Graphing
- 5-1 Sample Graphs
- 5-2 Controlling What Appears on a Graph Screen
- 5-3 Drawing a Graph
- 5-4 Storing a Graph in Picture Memory
- 5-5 Drawing Two Graphs on the Same Screen
- 5-6 Manual Graphing
- 5-7 Using Tables
- 5-8 Dynamic Graphing
- 5-9 Graphing a Recursion Formula
- 5-10 Changing the Appearance of a Graph
- 5-11 Function Analysis
- Chapter 6 Statistical Graphs and Calculations
- Chapter 7 Financial Calculation (TVM)
- Chapter 8 Programming
- Chapter 9 Spreadsheet
- Chapter 10 eActivity
- Chapter 11 System Settings Menu
- Chapter 12 Data Communications
- Appendix
20070201
k Calculating the Root
Description
This feature provides a number of different methods for analyzing graphs.
Set Up
1. From the Main Menu, enter the GRAPH mode.
2. Draw the graphs.
Execution
3. Select the analysis function.
!5 (G-SLV)1 (ROOT) ... Calculation of root
2 (MAX) ... Local maximum value
3 (MIN) ... Local minimum value
4 (Y-ICPT) ...
y -intercept
5 (ISCT) ... Intersection of two graphs
6 (g )1 (Y-CAL) ...
y -coordinate for given x -coordinate
6 (g )2 (X-CAL) ...
x -coordinate for given y -coordinate
6 (g )3 ( ∫
dx ) ... Integral value for a given range
4. When there are multiple graphs on the screen, the selection cursor (k ) is located at the
lowest numbered graph. Press f and c to move the cursor to the graph you want to
select.
5. Press w to select the graph where the cursor is located and display the value
produced by the analysis.
When an analysis produces multiple values, press e to calculate the next value.
Pressing d returns to the previous value.
5-11-9
Function Analysis