
User's Manual

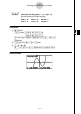
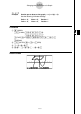
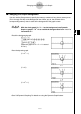
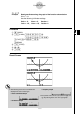
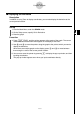
Table Of Contents
- Quick-Start
- Precautions when Using this Product
- Contents
- Getting Acquainted— Read This First!
- Chapter 1 Basic Operation
- Chapter 2 Manual Calculations
- Chapter 3 List Function
- Chapter 4 Equation Calculations
- Chapter 5 Graphing
- 5-1 Sample Graphs
- 5-2 Controlling What Appears on a Graph Screen
- 5-3 Drawing a Graph
- 5-4 Storing a Graph in Picture Memory
- 5-5 Drawing Two Graphs on the Same Screen
- 5-6 Manual Graphing
- 5-7 Using Tables
- 5-8 Dynamic Graphing
- 5-9 Graphing a Recursion Formula
- 5-10 Changing the Appearance of a Graph
- 5-11 Function Analysis
- Chapter 6 Statistical Graphs and Calculations
- Chapter 7 Financial Calculation (TVM)
- Chapter 8 Programming
- Chapter 9 Spreadsheet
- Chapter 10 eActivity
- Chapter 11 System Settings Menu
- Chapter 12 Data Communications
- Appendix
20070201
k Graph to Table
Description
You can use trace to read the coordinates of a graph and store them in a number table. You
can also use Dual Graph to simultaneously store the graph and number table, making this an
important graph analysis tool.
Set Up
1. From the Main Menu, enter the GRAPH mode.
2. On the Setup screen, specify GtoT for Dual Screen.
3. Make V-Window settings.
Execution
4. Save the function and draw the graph on the active (left) screen.
5. Activate Trace. When there are multiple graphs on the display, press f and c to
select the graph you want.
6. Use d and e to move the pointer and press w to store coordinates into the
number table. Repeat this step to store as many values as you want.
7. Press K 1 (CHNG) to make the number table active.
8. From the pop-up window, input the list number you want to save.
5-11-5
Function Analysis