
User's Manual

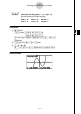
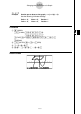
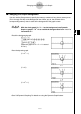
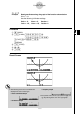
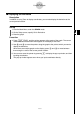
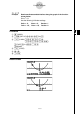
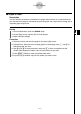
Table Of Contents
- Quick-Start
- Precautions when Using this Product
- Contents
- Getting Acquainted— Read This First!
- Chapter 1 Basic Operation
- Chapter 2 Manual Calculations
- Chapter 3 List Function
- Chapter 4 Equation Calculations
- Chapter 5 Graphing
- 5-1 Sample Graphs
- 5-2 Controlling What Appears on a Graph Screen
- 5-3 Drawing a Graph
- 5-4 Storing a Graph in Picture Memory
- 5-5 Drawing Two Graphs on the Same Screen
- 5-6 Manual Graphing
- 5-7 Using Tables
- 5-8 Dynamic Graphing
- 5-9 Graphing a Recursion Formula
- 5-10 Changing the Appearance of a Graph
- 5-11 Function Analysis
- Chapter 6 Statistical Graphs and Calculations
- Chapter 7 Financial Calculation (TVM)
- Chapter 8 Programming
- Chapter 9 Spreadsheet
- Chapter 10 eActivity
- Chapter 11 System Settings Menu
- Chapter 12 Data Communications
- Appendix
20070201
Example Read coordinates along the graph of the function shown below.
Y1 =
x
2
– 3
Use the following V-Window settings.
Xmin = –5, Xmax = 5, Xscale = 1
Ymin = –10, Ymax = 10, Yscale = 2
Procedure
1 m GRAPH
2 !3 (V-WIN) - f w f w b w c
- ba w ba w c wJ
3 (TYPE)1 (Y=)vx -d w
6 (DRAW)
3 !1 (TRCE)
4 d ~d
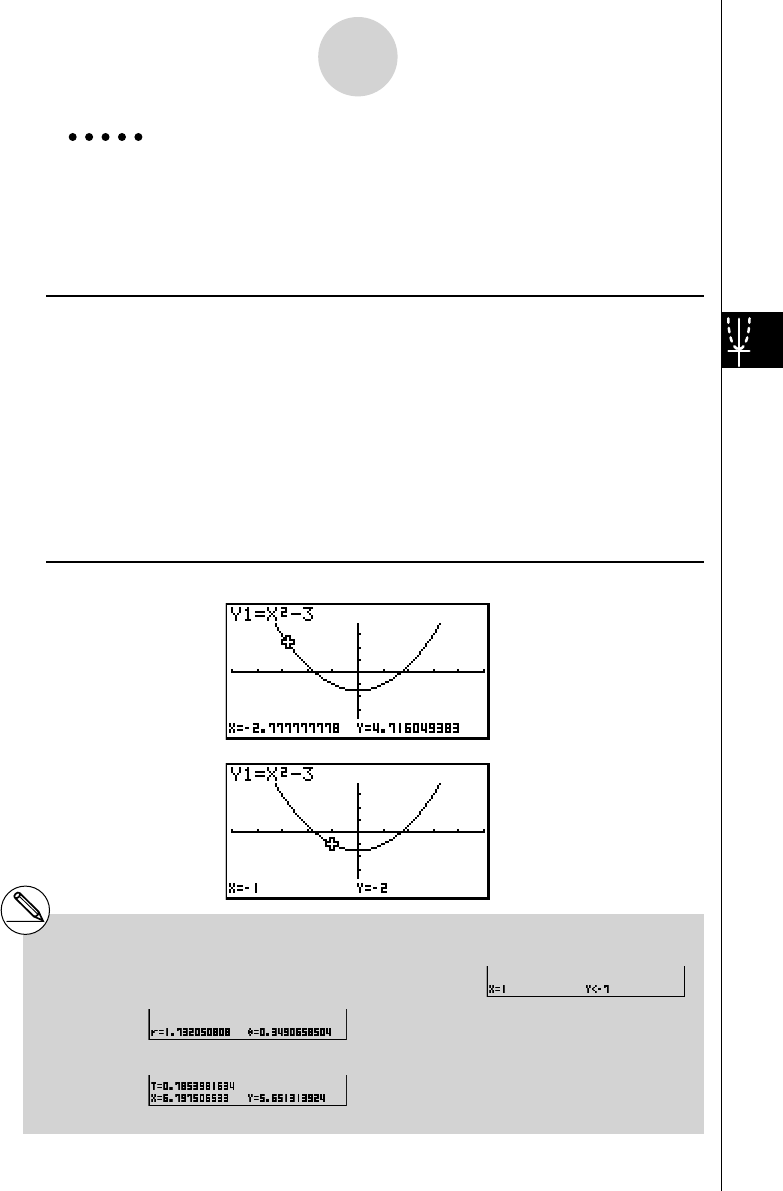
5 - b w
Result Screen
5-11-2
Function Analysis
# The following shows how coordinates are
displayed for each function type.
• Polar Coordinate Graph
• Parametric Graph
• Inequality Graph
# The pointer will not move if you press the d and
e keys during trace of an “X=c” type graph.