
User's Manual
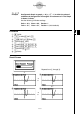
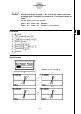
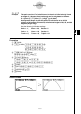
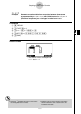
Table Of Contents
- Quick-Start
- Precautions when Using this Product
- Contents
- Getting Acquainted— Read This First!
- Chapter 1 Basic Operation
- Chapter 2 Manual Calculations
- Chapter 3 List Function
- Chapter 4 Equation Calculations
- Chapter 5 Graphing
- 5-1 Sample Graphs
- 5-2 Controlling What Appears on a Graph Screen
- 5-3 Drawing a Graph
- 5-4 Storing a Graph in Picture Memory
- 5-5 Drawing Two Graphs on the Same Screen
- 5-6 Manual Graphing
- 5-7 Using Tables
- 5-8 Dynamic Graphing
- 5-9 Graphing a Recursion Formula
- 5-10 Changing the Appearance of a Graph
- 5-11 Function Analysis
- Chapter 6 Statistical Graphs and Calculations
- Chapter 7 Financial Calculation (TVM)
- Chapter 8 Programming
- Chapter 9 Spreadsheet
- Chapter 10 eActivity
- Chapter 11 System Settings Menu
- Chapter 12 Data Communications
- Appendix
20070201
5-8-4
Dynamic Graphing
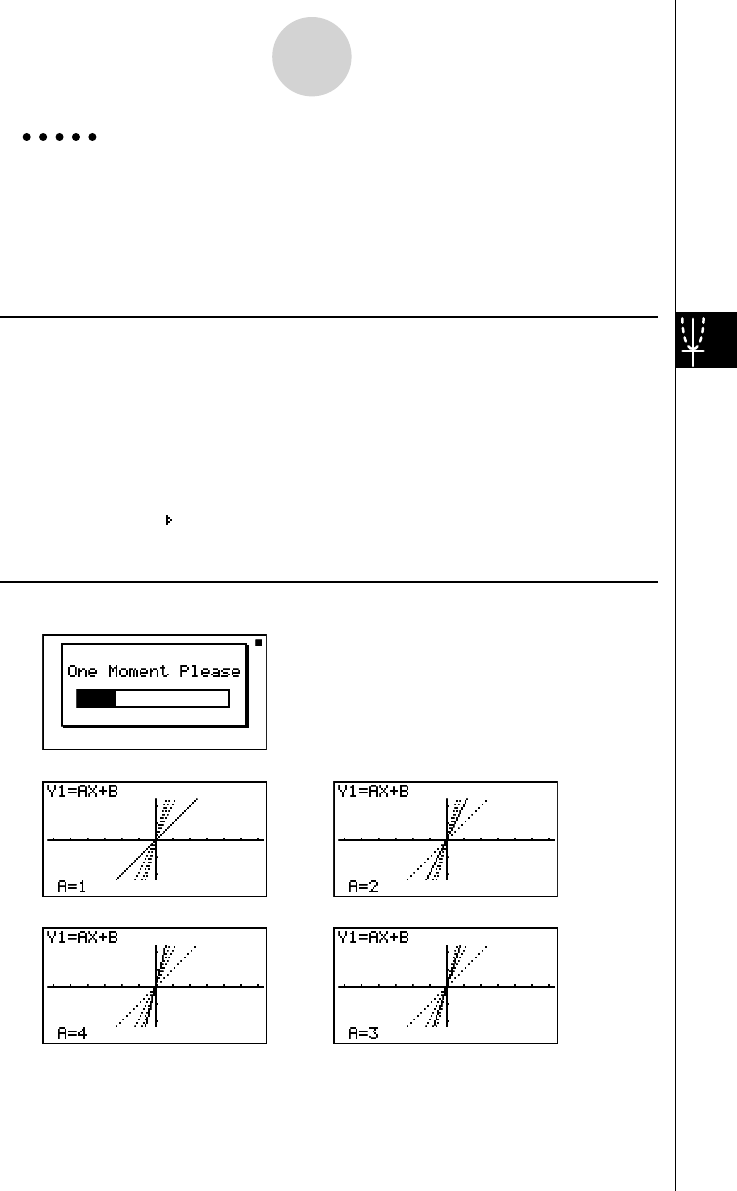
Example Use Dynamic Graph to graph
y = A x , in which the value of coeffi cient
A changes from 1 through 4 in increments of 1. The Graph is drawn 10
times.
Use the following V-Window settings.
Xmin = –6.3, Xmax = 6.3, Xscale = 1
Ymin = –3.1, Ymax = 3.1, Yscale = 1 (initial defaults)
Procedure
1 m DYNA
2 !3 (V-WIN)1 (INIT)J
3 !m (SET UP)c 1 (On)J
4 5 (B-IN)1 (SEL)
5 4 (VAR)b w a w
6 2 (SET)b w e w b wJ
7 3 (SPEED)3 (
)J
8 6 (DYNA)
Result Screen
Repeats from 1 through 4 .
1
4
2
3
→
←
→
←
↓
↓ ↑
1
4
2
3
→
←
→
←
↓
↓ ↑