
User's Manual
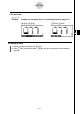
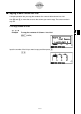
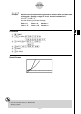
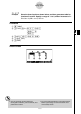
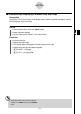
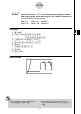
Table Of Contents
- Quick-Start
- Precautions when Using this Product
- Contents
- Getting Acquainted— Read This First!
- Chapter 1 Basic Operation
- Chapter 2 Manual Calculations
- Chapter 3 List Function
- Chapter 4 Equation Calculations
- Chapter 5 Graphing
- 5-1 Sample Graphs
- 5-2 Controlling What Appears on a Graph Screen
- 5-3 Drawing a Graph
- 5-4 Storing a Graph in Picture Memory
- 5-5 Drawing Two Graphs on the Same Screen
- 5-6 Manual Graphing
- 5-7 Using Tables
- 5-8 Dynamic Graphing
- 5-9 Graphing a Recursion Formula
- 5-10 Changing the Appearance of a Graph
- 5-11 Function Analysis
- Chapter 6 Statistical Graphs and Calculations
- Chapter 7 Financial Calculation (TVM)
- Chapter 8 Programming
- Chapter 9 Spreadsheet
- Chapter 10 eActivity
- Chapter 11 System Settings Menu
- Chapter 12 Data Communications
- Appendix
20070201
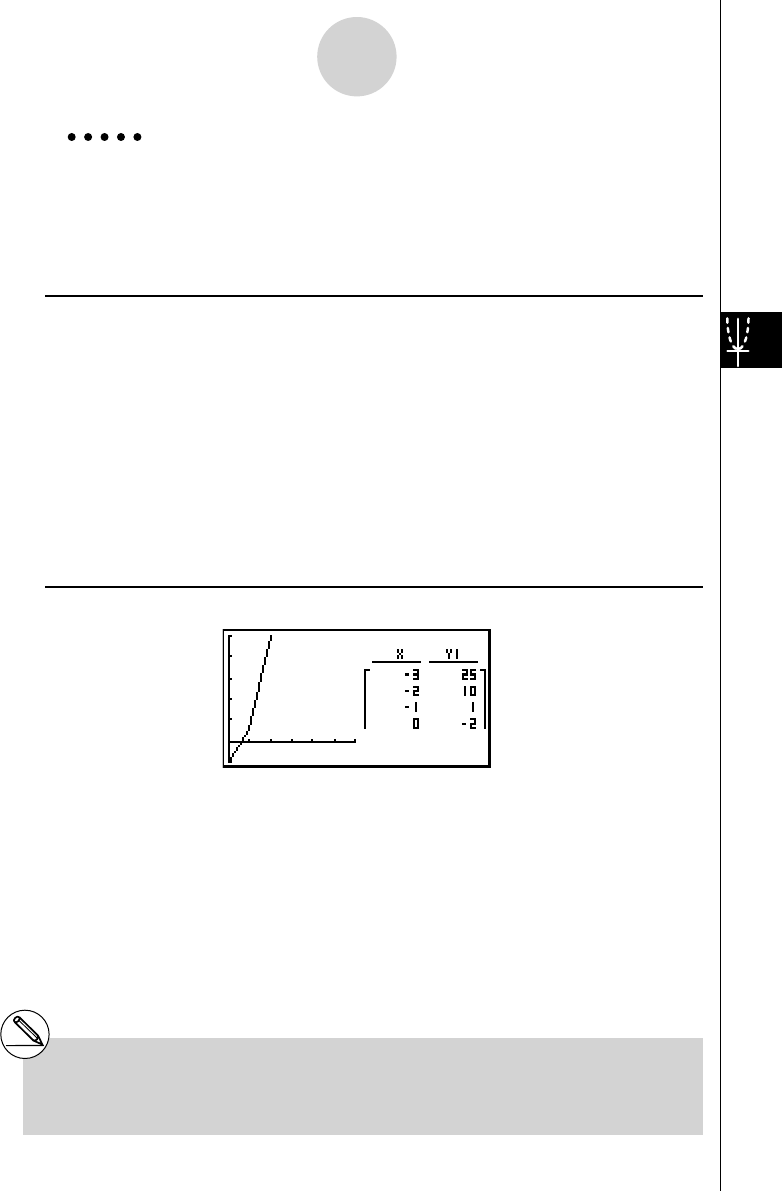
Example Store the function Y1 = 3
x
2
– 2 and simultaneously display its number
table and line graph. Use a table range of –3 to 3 with an increment of 1.
Use the following V-Window settings.
Xmin = 0, Xmax = 6, Xscale = 1
Ymin = –2, Ymax = 10, Yscale = 2
Procedure
1 m TABLE
2 !3 (V-WIN) a w g w b w c
- c w ba w c wJ
3 !m (SET UP)cc 1 (T+G)J
4 3 (TYPE)1 (Y=)d vx -c w
5 5 (SET)
- d w d w b wJ
6 6 (TABL)
7 5 (G
• CON)
Result Screen
5-7-14
Using Tables
# You can make the number table active by
pressing K 1 (CHNG) or A .
# After drawing a graph, you can return to the
number table screen by pressing !6 (G ↔ T)
or A .