
User's Manual
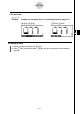
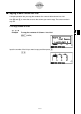
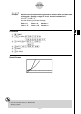
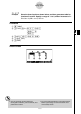
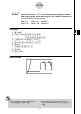
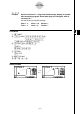
Table Of Contents
- Quick-Start
- Precautions when Using this Product
- Contents
- Getting Acquainted— Read This First!
- Chapter 1 Basic Operation
- Chapter 2 Manual Calculations
- Chapter 3 List Function
- Chapter 4 Equation Calculations
- Chapter 5 Graphing
- 5-1 Sample Graphs
- 5-2 Controlling What Appears on a Graph Screen
- 5-3 Drawing a Graph
- 5-4 Storing a Graph in Picture Memory
- 5-5 Drawing Two Graphs on the Same Screen
- 5-6 Manual Graphing
- 5-7 Using Tables
- 5-8 Dynamic Graphing
- 5-9 Graphing a Recursion Formula
- 5-10 Changing the Appearance of a Graph
- 5-11 Function Analysis
- Chapter 6 Statistical Graphs and Calculations
- Chapter 7 Financial Calculation (TVM)
- Chapter 8 Programming
- Chapter 9 Spreadsheet
- Chapter 10 eActivity
- Chapter 11 System Settings Menu
- Chapter 12 Data Communications
- Appendix
20070201
k Drawing a Graph from a Number Table
Description
Use the following procedure to generate a number table and then draw a graph based on the
values in the table.
Set Up
1. From the Main Menu, enter the TABLE mode.
2. Make V-Window settings.
Execution
3. Store the functions.
4. Specify the table range.
5. Generate the table.
6. Select the graph type and draw it.
5 (G
• CON) ... line graph*
1
6 (G
• PLT) ... plot type graph*
1
• Selecting 6 (G
• PLT) draws a 1-dot broken line plot type graph, regardless of the
currently selected line style (page 5-3-6).
5-7-9
Using Tables
*
1
After drawing the graph, pressing !
6 (G ↔ T) or A returns to the number
table screen.