User's Manual
Table Of Contents
- Quick-Start
- Precautions when Using this Product
- Contents
- Getting Acquainted— Read This First!
- Chapter 1 Basic Operation
- Chapter 2 Manual Calculations
- Chapter 3 List Function
- Chapter 4 Equation Calculations
- Chapter 5 Graphing
- 5-1 Sample Graphs
- 5-2 Controlling What Appears on a Graph Screen
- 5-3 Drawing a Graph
- 5-4 Storing a Graph in Picture Memory
- 5-5 Drawing Two Graphs on the Same Screen
- 5-6 Manual Graphing
- 5-7 Using Tables
- 5-8 Dynamic Graphing
- 5-9 Graphing a Recursion Formula
- 5-10 Changing the Appearance of a Graph
- 5-11 Function Analysis
- Chapter 6 Statistical Graphs and Calculations
- Chapter 7 Financial Calculation (TVM)
- Chapter 8 Programming
- Chapter 9 Spreadsheet
- Chapter 10 eActivity
- Chapter 11 System Settings Menu
- Chapter 12 Data Communications
- Appendix

20070201
You can use cursor keys to move the highlighting around the table for the following purposes.
• To display the selected cell’s value at the bottom of the screen, using the calculator’s
current number of decimal place, number of signifi cant digit, and exponential display
range settings
• To scroll the display and view parts of the table that do not fi t in the display
• To display at the top of the screen the scientifi c function that produced the value in the
selected cell (in columns Y1, Y2, etc.)
• To change
x variable values by replacing values in column X
Press 1 (FORM) or J to return to the Table relation list.
u To generate a differential number table *
1
Changing the setting of Setup screen’s Derivative item to On causes a number table that
includes the derivative to be displayed whenever you generate a number table.
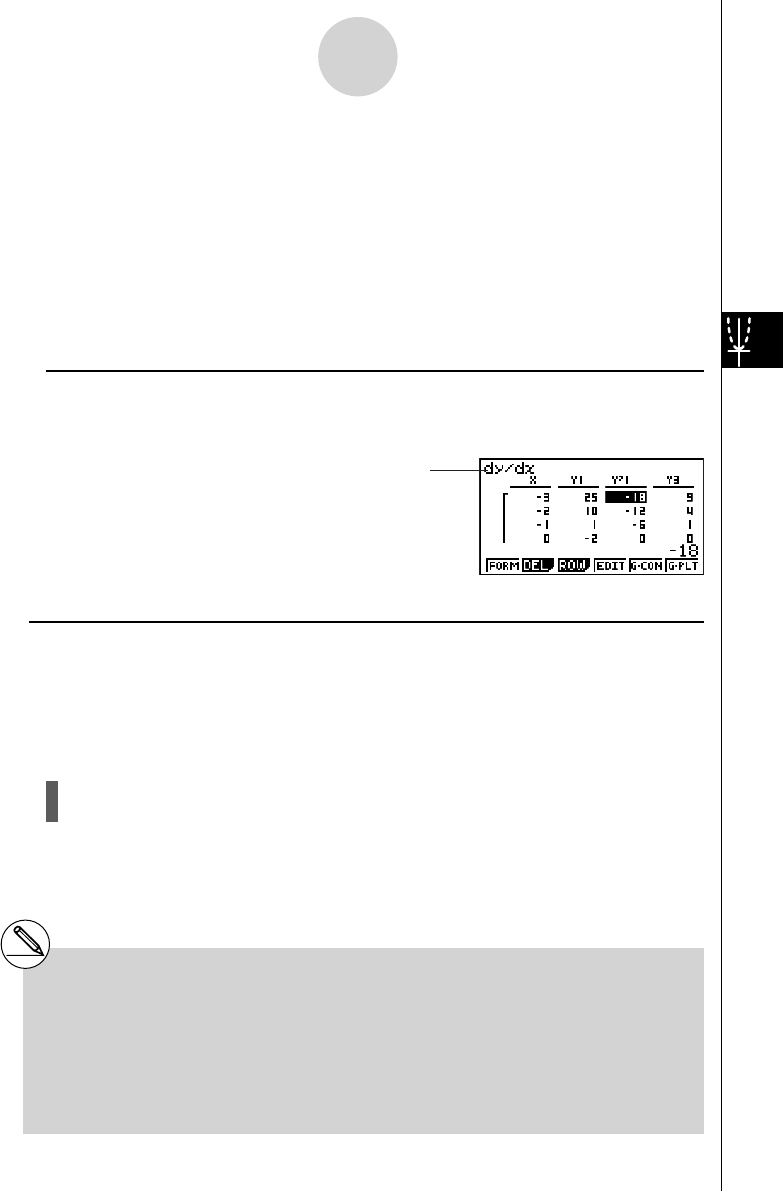
Locating the cursor at a differential
coeffi cient displays “
dy / dx ” in the top line,
which indicates differential.
u Specifying the function type
You can specify a function as being one of three types.*
2
• Rectangular coordinate (Y=)
• Polar coordinate (
r =)
• Parametric (Parm)
1. Press 3 (TYPE) while the relation list is on the screen.
2. Press the number key that corresponds to the function type you want to specify.
5-7-3
Using Tables
*
1
An error occurs if a graph for which a range
is specifi ed or an overwrite graph is included
among the graph expressions.
*
2
The number table is generated only for the
function type specifi ed on the relation list
(Table Func). You cannot generate a number
table for a mixture of different function types.
The function type specifi ed in the GRAPH mode
is not one of these three, entering the TABLE
mode causes the function type to change to
rectangular coordinate (Y=).


