
User's Manual
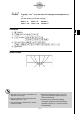
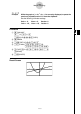
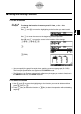
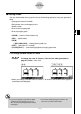
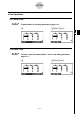
Table Of Contents
- Quick-Start
- Precautions when Using this Product
- Contents
- Getting Acquainted— Read This First!
- Chapter 1 Basic Operation
- Chapter 2 Manual Calculations
- Chapter 3 List Function
- Chapter 4 Equation Calculations
- Chapter 5 Graphing
- 5-1 Sample Graphs
- 5-2 Controlling What Appears on a Graph Screen
- 5-3 Drawing a Graph
- 5-4 Storing a Graph in Picture Memory
- 5-5 Drawing Two Graphs on the Same Screen
- 5-6 Manual Graphing
- 5-7 Using Tables
- 5-8 Dynamic Graphing
- 5-9 Graphing a Recursion Formula
- 5-10 Changing the Appearance of a Graph
- 5-11 Function Analysis
- Chapter 6 Statistical Graphs and Calculations
- Chapter 7 Financial Calculation (TVM)
- Chapter 8 Programming
- Chapter 9 Spreadsheet
- Chapter 10 eActivity
- Chapter 11 System Settings Menu
- Chapter 12 Data Communications
- Appendix
20070201
5-6-8
Manual Graphing
Example While the graph of
y = 2 x
2
+ 3 x – 4 is currently displayed, to paste the
previously copied function Y=X from the clipboard
Use the following V-Window settings.
Xmin = –5, Xmax = 5, Xscale = 2
Ymin = –10, Ymax = 10, Yscale = 5
Procedure
1 m RUN
•
MAT
a - (Y)! . (=)v
! i (CLIP)ddd 1 (COPY)
2 m GRAPH
3 !m (SET UP)cc 3 (Off)J
4 !3 (V-WIN) - f w f w c w c
- ba w ba w f wJ
5 3 (TYPE)1 (Y=)c vx +d v -e w
6 (DRAW)
6 ! j (PASTE)
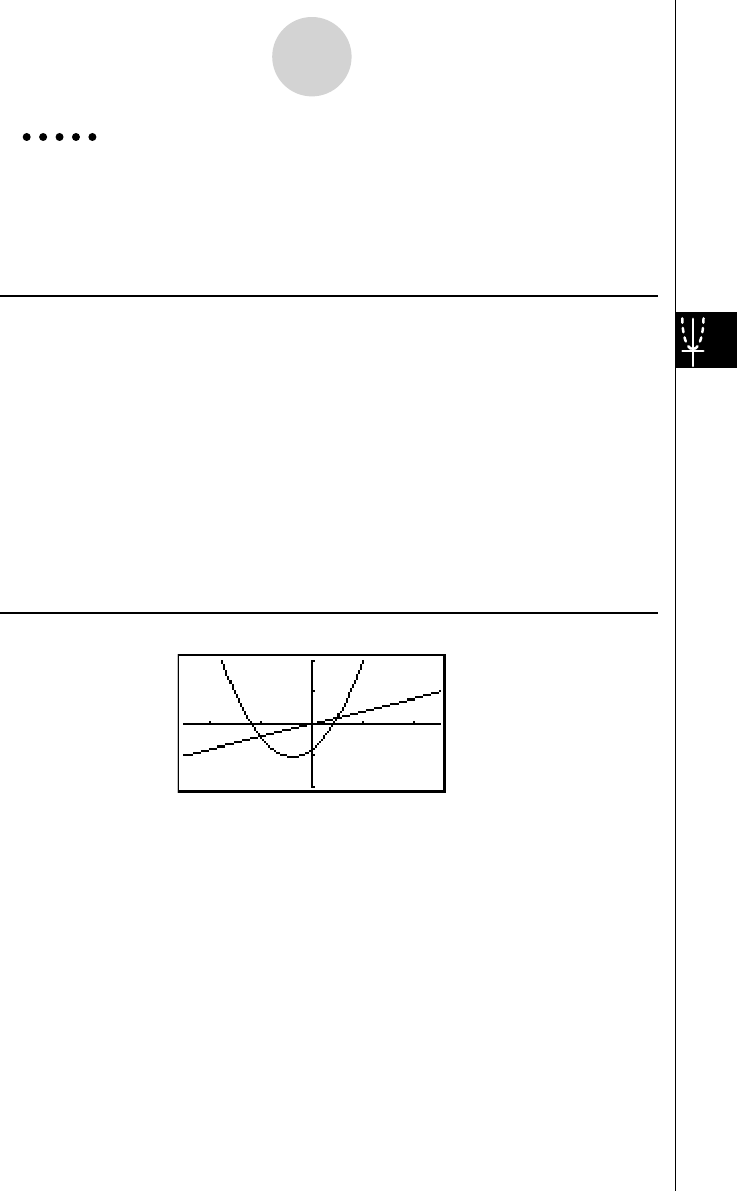
Result Screen