
User's Manual
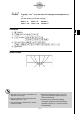
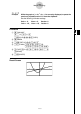
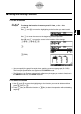
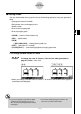
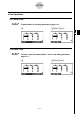
Table Of Contents
- Quick-Start
- Precautions when Using this Product
- Contents
- Getting Acquainted— Read This First!
- Chapter 1 Basic Operation
- Chapter 2 Manual Calculations
- Chapter 3 List Function
- Chapter 4 Equation Calculations
- Chapter 5 Graphing
- 5-1 Sample Graphs
- 5-2 Controlling What Appears on a Graph Screen
- 5-3 Drawing a Graph
- 5-4 Storing a Graph in Picture Memory
- 5-5 Drawing Two Graphs on the Same Screen
- 5-6 Manual Graphing
- 5-7 Using Tables
- 5-8 Dynamic Graphing
- 5-9 Graphing a Recursion Formula
- 5-10 Changing the Appearance of a Graph
- 5-11 Function Analysis
- Chapter 6 Statistical Graphs and Calculations
- Chapter 7 Financial Calculation (TVM)
- Chapter 8 Programming
- Chapter 9 Spreadsheet
- Chapter 10 eActivity
- Chapter 11 System Settings Menu
- Chapter 12 Data Communications
- Appendix
20070201
5-6-6
Manual Graphing
Example To graph y = A
x
2
– 3 as the value of A changes in the sequence 3, 1,
–1.
Use the following V-Window settings.
Xmin = –5, Xmax = 5, Xscale = 1
Ymin = –10, Ymax = 10, Yscale = 2
Procedure
1 m GRAPH
2 !m (SET UP)cc 3 (Off)J
3 !3 (V-WIN) - f w f w b w c
- ba w ba w c wJ
4 3 (TYPE)1 (Y=)av (A)vx -d,
! + ( [ )av (A)! . (=)d,b, - b ! - ( ] )w
5 6 (DRAW)
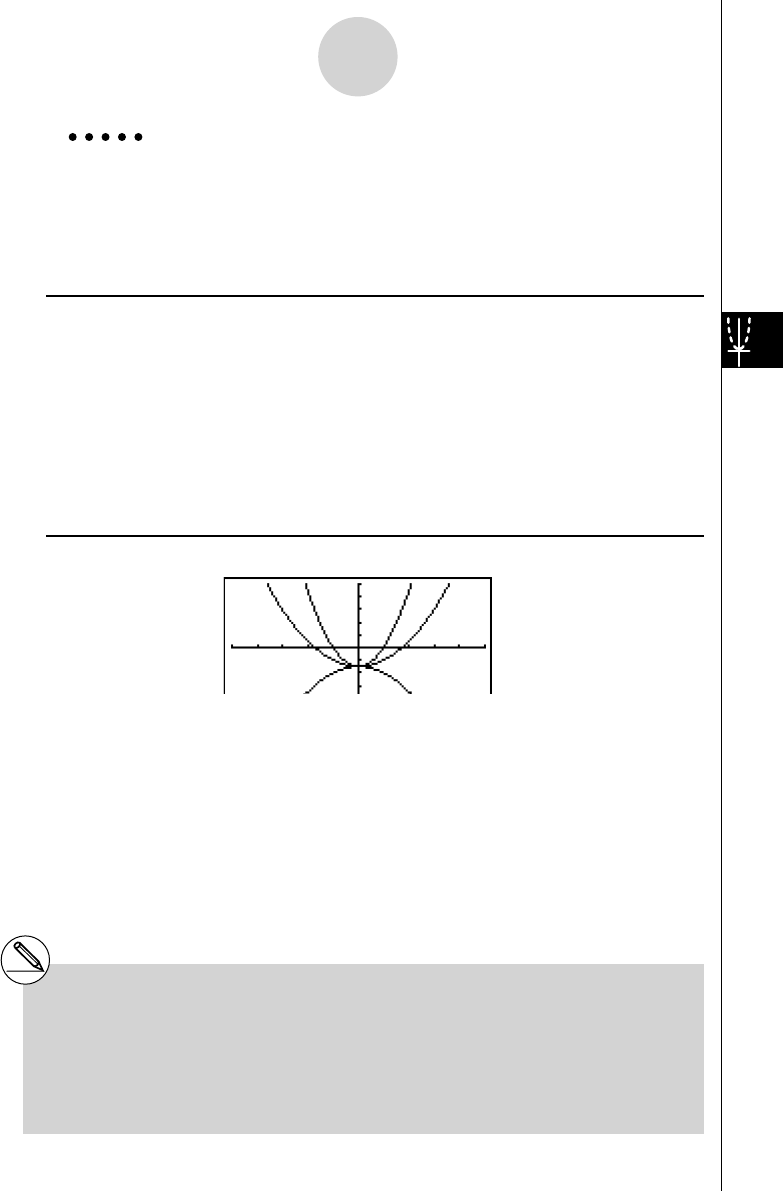
Result Screen
# The value of only one of the variables in the
expression can change.
# Any of the following cannot be used for the
variable name: X, Y,
r ,
θ
, T.
# You cannot assign a variable to the variable
inside the function.
# When Simul Graph is turned on, all of the
graphs for the specifi ed variable values are
drawn simultaneously.
# Overwrite can be used when graphing
rectangular expressions, polar expressions,
parametric functions, X = constant functions,
and inequalities.