
User's Manual
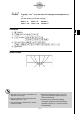
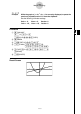
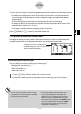
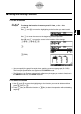
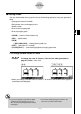
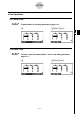
Table Of Contents
- Quick-Start
- Precautions when Using this Product
- Contents
- Getting Acquainted— Read This First!
- Chapter 1 Basic Operation
- Chapter 2 Manual Calculations
- Chapter 3 List Function
- Chapter 4 Equation Calculations
- Chapter 5 Graphing
- 5-1 Sample Graphs
- 5-2 Controlling What Appears on a Graph Screen
- 5-3 Drawing a Graph
- 5-4 Storing a Graph in Picture Memory
- 5-5 Drawing Two Graphs on the Same Screen
- 5-6 Manual Graphing
- 5-7 Using Tables
- 5-8 Dynamic Graphing
- 5-9 Graphing a Recursion Formula
- 5-10 Changing the Appearance of a Graph
- 5-11 Function Analysis
- Chapter 6 Statistical Graphs and Calculations
- Chapter 7 Financial Calculation (TVM)
- Chapter 8 Programming
- Chapter 9 Spreadsheet
- Chapter 10 eActivity
- Chapter 11 System Settings Menu
- Chapter 12 Data Communications
- Appendix
20070201
5-6-5
Manual Graphing
k Drawing Multiple Graphs on the Same Screen
Description
Use the following procedure to assign various values to a variable contained in an expression
and overwrite the resulting graphs on the screen.
Set Up
1. From the Main Menu, enter the GRAPH mode.
2. On the Setup screen, change the “Dual Screen” setting to “Off”.
3. Make V-Window settings.
Execution
4. Specify the function type and input the function. The following is the syntax for function
input.
Expression containing one variable , ! + ( [ ) variable ! . (=)
value , value , ... , value ! - ( ] )
5. Draw the graph.