
User's Manual
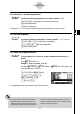
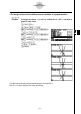
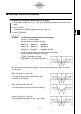
Table Of Contents
- Quick-Start
- Precautions when Using this Product
- Contents
- Getting Acquainted— Read This First!
- Chapter 1 Basic Operation
- Chapter 2 Manual Calculations
- Chapter 3 List Function
- Chapter 4 Equation Calculations
- Chapter 5 Graphing
- 5-1 Sample Graphs
- 5-2 Controlling What Appears on a Graph Screen
- 5-3 Drawing a Graph
- 5-4 Storing a Graph in Picture Memory
- 5-5 Drawing Two Graphs on the Same Screen
- 5-6 Manual Graphing
- 5-7 Using Tables
- 5-8 Dynamic Graphing
- 5-9 Graphing a Recursion Formula
- 5-10 Changing the Appearance of a Graph
- 5-11 Function Analysis
- Chapter 6 Statistical Graphs and Calculations
- Chapter 7 Financial Calculation (TVM)
- Chapter 8 Programming
- Chapter 9 Spreadsheet
- Chapter 10 eActivity
- Chapter 11 System Settings Menu
- Chapter 12 Data Communications
- Appendix
20070201
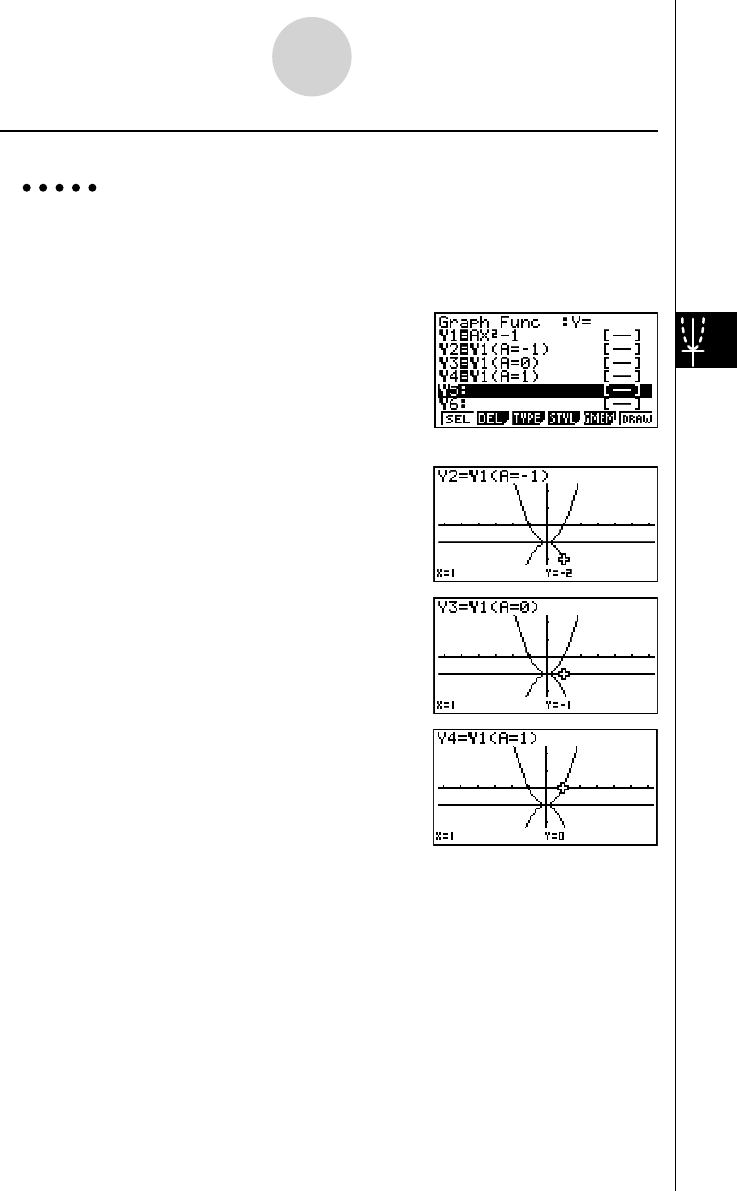
u To assign values to the coeffi cients and variables of a graph function
Example To assign the values −1, 0, and 1 to variable A in Y = AX
2
−1, and draw a
graph for each value
3 (TYPE)1 (Y=)
av (A)vx -b w
J 4 (GRPH)1 (Y)b( av (A)
! . (=)- b) w
J 4 (GRPH)1 (Y)b( av (A)
! . (=)a) w
J 4 (GRPH)1 (Y)b( av (A)
! . (=)b) w
ffff 1 (SEL)
6 (DRAW)
The above three screens are produced using the Trace function.
See “5-11 Function Analysis” for more information.
5-3-4
Drawing a Graph