
User's Manual
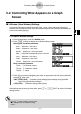
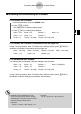
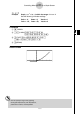
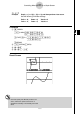
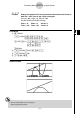
Table Of Contents
- Quick-Start
- Precautions when Using this Product
- Contents
- Getting Acquainted— Read This First!
- Chapter 1 Basic Operation
- Chapter 2 Manual Calculations
- Chapter 3 List Function
- Chapter 4 Equation Calculations
- Chapter 5 Graphing
- 5-1 Sample Graphs
- 5-2 Controlling What Appears on a Graph Screen
- 5-3 Drawing a Graph
- 5-4 Storing a Graph in Picture Memory
- 5-5 Drawing Two Graphs on the Same Screen
- 5-6 Manual Graphing
- 5-7 Using Tables
- 5-8 Dynamic Graphing
- 5-9 Graphing a Recursion Formula
- 5-10 Changing the Appearance of a Graph
- 5-11 Function Analysis
- Chapter 6 Statistical Graphs and Calculations
- Chapter 7 Financial Calculation (TVM)
- Chapter 8 Programming
- Chapter 9 Spreadsheet
- Chapter 10 eActivity
- Chapter 11 System Settings Menu
- Chapter 12 Data Communications
- Appendix
20070201
5-2-10
Controlling What Appears on a Graph Screen
Example Enlarge the graphs of the two expressions shown below fi ve times on
both the x - and y -axis to see if they are tangent.
Y1 = (
x + 4)( x + 1)( x – 3), Y2 = 3 x + 22
Use the following V-Window settings.
Xmin = –8, Xmax = 8, Xscale = 1
Ymin = –30, Ymax = 30, Yscale = 5
Procedure
1 m GRAPH
!3 (V-WIN) - i w i w b w c
- da w da w f wJ
3 (TYPE)1 (Y=) ( v +e)( v +b)
( v -d) w
d v +cc w
6 (DRAW)
2 !2 (ZOOM)2 (FACT)f w f wJ
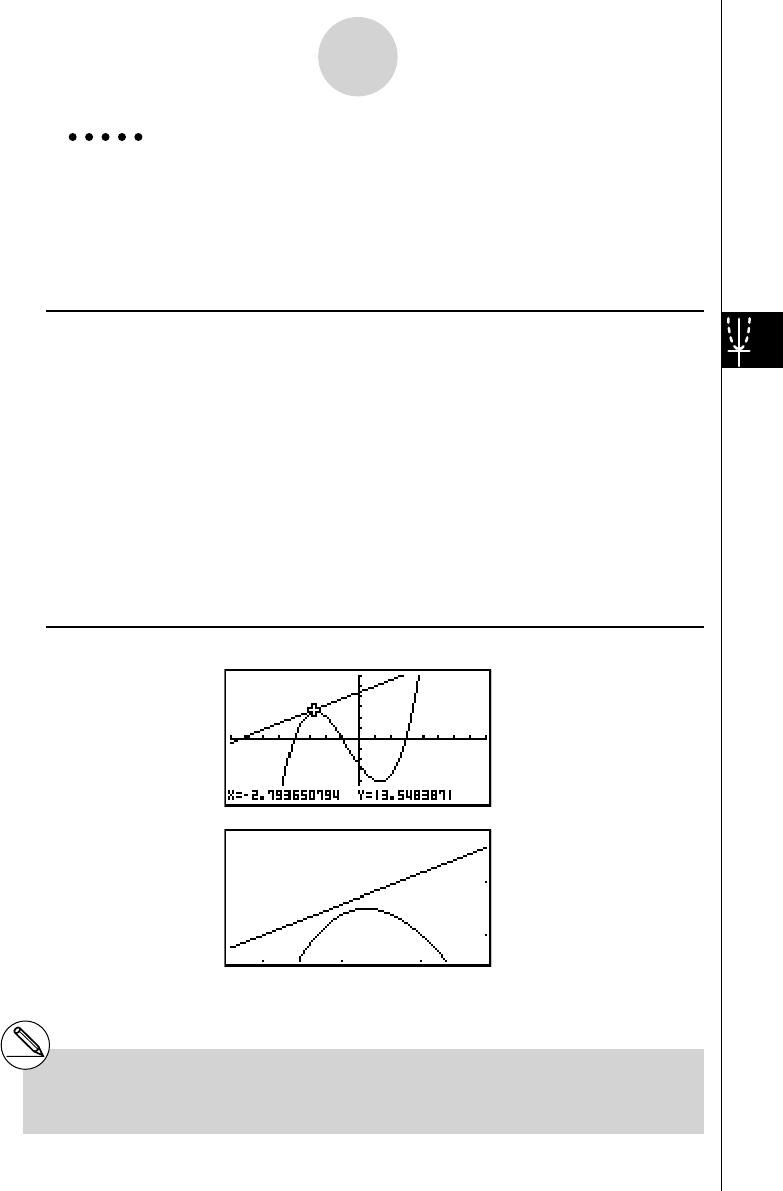
3 !2 (ZOOM)3 (IN)
4 f ~f ,d ~d w
Result Screen
# You can repeat factor zoom to enlarge or
reduce a graph even further.