
User's Manual
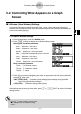
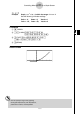
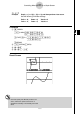
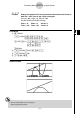
Table Of Contents
- Quick-Start
- Precautions when Using this Product
- Contents
- Getting Acquainted— Read This First!
- Chapter 1 Basic Operation
- Chapter 2 Manual Calculations
- Chapter 3 List Function
- Chapter 4 Equation Calculations
- Chapter 5 Graphing
- 5-1 Sample Graphs
- 5-2 Controlling What Appears on a Graph Screen
- 5-3 Drawing a Graph
- 5-4 Storing a Graph in Picture Memory
- 5-5 Drawing Two Graphs on the Same Screen
- 5-6 Manual Graphing
- 5-7 Using Tables
- 5-8 Dynamic Graphing
- 5-9 Graphing a Recursion Formula
- 5-10 Changing the Appearance of a Graph
- 5-11 Function Analysis
- Chapter 6 Statistical Graphs and Calculations
- Chapter 7 Financial Calculation (TVM)
- Chapter 8 Programming
- Chapter 9 Spreadsheet
- Chapter 10 eActivity
- Chapter 11 System Settings Menu
- Chapter 12 Data Communications
- Appendix
20070201
k Specifying the Graph Range
Description
You can defi ne a range (start point, end point) for a function before graphing it.
Set Up
1. From the Main Menu, enter the GRAPH mode.
2. Make V-Window settings.
Execution
3. Specify the function type and input the function. The following is the syntax for function
input.
Function , ! + ( [ )Start Point , End Point ! - ( ] )
4. Draw the graph.
5-2-5
Controlling What Appears on a Graph Screen