
User's Manual
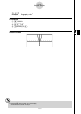

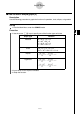
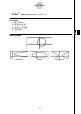
Table Of Contents
- Quick-Start
- Precautions when Using this Product
- Contents
- Getting Acquainted— Read This First!
- Chapter 1 Basic Operation
- Chapter 2 Manual Calculations
- Chapter 3 List Function
- Chapter 4 Equation Calculations
- Chapter 5 Graphing
- 5-1 Sample Graphs
- 5-2 Controlling What Appears on a Graph Screen
- 5-3 Drawing a Graph
- 5-4 Storing a Graph in Picture Memory
- 5-5 Drawing Two Graphs on the Same Screen
- 5-6 Manual Graphing
- 5-7 Using Tables
- 5-8 Dynamic Graphing
- 5-9 Graphing a Recursion Formula
- 5-10 Changing the Appearance of a Graph
- 5-11 Function Analysis
- Chapter 6 Statistical Graphs and Calculations
- Chapter 7 Financial Calculation (TVM)
- Chapter 8 Programming
- Chapter 9 Spreadsheet
- Chapter 10 eActivity
- Chapter 11 System Settings Menu
- Chapter 12 Data Communications
- Appendix

20070201
k How to draw a simple graph (4)
Description
You can specify the graph line style, if you want.
Set Up
1. From the Main Menu, enter the GRAPH mode.
Execution
2. Input the function you want to graph.
Here you would use the V-Window to specify the range and other parameters of the
graph. See 5-2-1.
3. Select the line style.
4 (STYL) 1 (
) … Normal (initial default)
2 (
) … Thick (twice the thickness of Normal)
3 (
) … Broken (thick broken)
4 (
) … Dot (dotted)
4. Draw the graph.
The line style selection is valid only when “Connect” is selected for “Draw Type” on the Setup
screen.
5-1-7
Sample Graphs
# The initial default line setting for an inequality
(Y>, Y<) is dot plot type.
# You can change the graph line style while in the
GRAPH , TABLE or RECUR mode.