
User's Manual
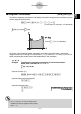
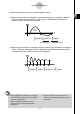
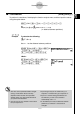


Table Of Contents
- Quick-Start
- Precautions when Using this Product
- Contents
- Getting Acquainted— Read This First!
- Chapter 1 Basic Operation
- Chapter 2 Manual Calculations
- Chapter 3 List Function
- Chapter 4 Equation Calculations
- Chapter 5 Graphing
- 5-1 Sample Graphs
- 5-2 Controlling What Appears on a Graph Screen
- 5-3 Drawing a Graph
- 5-4 Storing a Graph in Picture Memory
- 5-5 Drawing Two Graphs on the Same Screen
- 5-6 Manual Graphing
- 5-7 Using Tables
- 5-8 Dynamic Graphing
- 5-9 Graphing a Recursion Formula
- 5-10 Changing the Appearance of a Graph
- 5-11 Function Analysis
- Chapter 6 Statistical Graphs and Calculations
- Chapter 7 Financial Calculation (TVM)
- Chapter 8 Programming
- Chapter 9 Spreadsheet
- Chapter 10 eActivity
- Chapter 11 System Settings Menu
- Chapter 12 Data Communications
- Appendix
20070201
2-5-12
Numerical Calculations
k Maximum/Minimum Value Calculations [OPTN] - [CALC] - [FMin]/[FMax]
After displaying the function analysis menu, you can input maximum/minimum calculations
using the formats below, and solve for the maximum and minimum of a function within
interval
a < x < b .
u Minimum Value
K 4 (CALC)6 (g )1 (FMin) f
( x ) , a , b , n )
(
a : start point of interval, b : end point of interval, n : precision ( n = 1 to 9))
u Maximum Value
K 4 (CALC)6 (g )2 (FMax) f
( x ), a , b , n )
(
a : start point of interval, b : end point of interval, n : precision ( n = 1 to 9))
Example 1 To determine the minimum value for the interval defi ned by start
point
a = 0 and end point b = 3, with a precision of n = 6 for the
function y = x
2
– 4 x + 9
Input
f
( x ).
A K 4 (CALC)6 (g )1 (FMin) vx -e v +j,
Input the interval
a = 0, b = 3.
a,d,
Input the precision
n = 6.
g)
w