
User's Manual

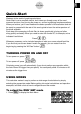
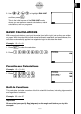
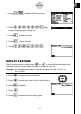
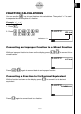
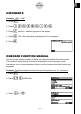
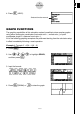
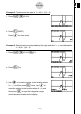
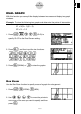
Table Of Contents
- Quick-Start
- Precautions when Using this Product
- Contents
- Getting Acquainted— Read This First!
- Chapter 1 Basic Operation
- Chapter 2 Manual Calculations
- Chapter 3 List Function
- Chapter 4 Equation Calculations
- Chapter 5 Graphing
- 5-1 Sample Graphs
- 5-2 Controlling What Appears on a Graph Screen
- 5-3 Drawing a Graph
- 5-4 Storing a Graph in Picture Memory
- 5-5 Drawing Two Graphs on the Same Screen
- 5-6 Manual Graphing
- 5-7 Using Tables
- 5-8 Dynamic Graphing
- 5-9 Graphing a Recursion Formula
- 5-10 Changing the Appearance of a Graph
- 5-11 Function Analysis
- Chapter 6 Statistical Graphs and Calculations
- Chapter 7 Financial Calculation (TVM)
- Chapter 8 Programming
- Chapter 9 Spreadsheet
- Chapter 10 eActivity
- Chapter 11 System Settings Menu
- Chapter 12 Data Communications
- Appendix

20070201
DUAL GRAPH
With this function you can split the display between two areas and display two graph
windows.
Example: To draw the following two graphs and determine the points of intersection
Y1 = X(X + 1)(X – 2)
Y2 = X + 1.2
1. Press
! m cc 1 (G+G) to
specify “G+G” for the Dual Screen setting.
2. Press
J , and then input the two functions.
v ( v +b)
( v -c) w
v +b.c w
3. Press
6 (DRAW) or w to draw the graphs.
Box Zoom
Use the Box Zoom function to specify areas of a graph for enlargement.
1. Press
!2 (ZOOM) 1 (BOX).
2. Use
d e f c to move the pointer to
one corner of the area you want to specify and then
press
w .
SET UPSET UP
8
Quick-Start