
User Manual
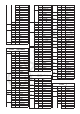
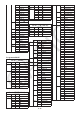

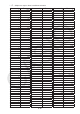
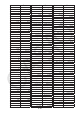


Table Of Contents
- Contenu
- Familiarisation — A lire en premier!
- Chapitre 1 Opérations de base
- Chapitre 2 Calculs manuels
- 1. Calculs de base
- 2. Fonctions spéciales
- 3. Spécification de l’unité d’angle et du format d’affichage
- 4. Calculs de fonctions
- 5. Calculs numériques
- 6. Calculs avec nombres complexes
- 7. Calculs binaire, octal, décimal et hexadécimal avec entiers
- 8. Calculs matriciels
- 9. Calculs vectoriels
- 10. Calculs de conversion métrique
- Chapitre 3 Listes
- Chapitre 4 Calcul d’équations
- Chapitre 5 Représentation graphique de fonctions
- 1. Exemples de graphes
- 2. Contrôle des paramètres apparaissant sur un écran graphique
- 3. Tracé d’un graphe
- 4. Stockage d’un graphe dans la mémoire d’images
- 5. Tracé de deux graphes sur le même écran
- 6. Représentation graphique manuelle
- 7. Utilisation de tables
- 8. Représentation graphique dynamique
- 9. Représentation graphique d’une formule de récurrence
- 10. Tracé du graphe d’une section conique
- 11. Changement de l’aspect d’un graphe
- 12. Analyse de fonctions
- Chapitre 6 Graphes et calculs statistiques
- 1. Avant d’effectuer des calculs statistiques
- 2. Calcul et représentation graphique de données statistiques à variable unique
- 3. Calcul et représentation graphique de données statistiques à variable double
- 4. Exécution de calculs statistiques
- 5. Tests
- 6. Intervalle de confiance
- 7. Lois de probabilité
- 8. Termes des tests d’entrée et sortie, intervalle de confiance et loi de probabilité
- 9. Formule statistique
- Chapitre 7 Calculs financiers (TVM)
- 1. Avant d’effectuer des calculs financiers
- 2. Intérêt simple
- 3. Intérêt composé
- 4. Cash-flow (Évaluation d’investissement)
- 5. Amortissement
- 6. Conversion de taux d’intérêt
- 7. Coût, prix de vente, marge
- 8. Calculs de jours/date
- 9. Dépréciation
- 10. Calculs d’obligations
- 11. Calculs financiers en utilisant des fonctions
- Chapitre 8 Programmation
- 1. Étapes élémentaires de la programmation
- 2. Touches de fonction du mode PRGM
- 3. Édition du contenu d’un programme
- 4. Gestion de fichiers
- 5. Guide des commandes
- 6. Utilisation des fonctions de la calculatrice dans un programme
- 7. Liste des commandes du mode PRGM
- 8. Tableau de conversion des commandes spéciales de la calculatrice scientifique CASIO <=> Texte
- 9. Bibliothèque de programmes
- Chapitre 9 Feuille de Calcul
- Chapitre 10 L’eActivity
- Chapitre 11 Gestionnaire de la mémoire
- Chapitre 12 Menu de réglages du système
- Chapitre 13 Communication de données
- Chapitre 14 PYTHON
- 1. Aperçu du mode PYTHON
- 2. Menu de fonctions de PYTHON
- 3. Saisie de texte et de commandes
- 4. Utilisation du SHELL
- 5. Utilisation des fonctions de tracé (module casioplot)
- 6. Modification d’un fichier py
- 7. Gestion de dossiers (recherche et suppression de fichiers)
- 8. Compatibilité de fichier
- 9. Exemples de scripts
- Chapitre 15 Distribution
- Appendice
- Mode Examen
- E-CON3 Application (English) (GRAPH35+ E II)
- 1 E-CON3 Overview
- 2 Using the Setup Wizard
- 3 Using Advanced Setup
- 4 Using a Custom Probe
- 5 Using the MULTIMETER Mode
- 6 Using Setup Memory
- 7 Using Program Converter
- 8 Starting a Sampling Operation
- 9 Using Sample Data Memory
- 10 Using the Graph Analysis Tools to Graph Data
- 11 Graph Analysis Tool Graph Screen Operations
- 12 Calling E-CON3 Functions from an eActivity

8-49
Commande Texte
Int Int
Not Not
^
^
×
¼
or
or
!
!
r
rad
minY
minY
minX
minX
n
Statn
sinh
1
sinh^−1
cosh
1
cosh^−1
tanh
1
tanh^−1
b
&b
10
(10)
Frac Frac
Neg Neg
x
'
Xrt
÷
/
and
and
{
frac
g
gra
maxY
maxY
maxX
maxX
∑y
2
Sigmay2
Ans
Ans
Ran#
Ran#
x¯
x-bar
y¯
y-bar
σx
sigmax
sx
Sx
σx
sigmay
sy
Sy
a
Regression_a
b
Regression_b
r
Regression_r
x
^
x-hat
y
^
y-hat
r
<r>
Theta
∑y
Sigmay
π
pi
Cls
Cls
Rnd
Rnd
Dec
&D
Hex
&H
Bin
&B
Oct
&O
@D8
Norm Norm
Deg
Deg
Rad
Rad
Gra
Gra
Eng
Eng
Intg Intg
Commande Texte
∑xy
Sigmaxy
Plot Plot
Line
Line
Lbl Lbl
Fix Fix
Sci Sci
Dsz Dsz
Isz Isz
Factor Factor
ViewWindow ViewWindow
Goto Goto
Prog Prog
GraphY= GraphY=
Graph
GraphIntegral
GraphY> GraphY>
GraphY< GraphY<
GraphY≥
GraphY>=
GraphY≤
GraphY<=
Graphr= Graphr=
Graph(X,Y)=( Graph(X,Y)=(
, Para,
P(
ProbP(
Q(
ProbQ(
R(
ProbR(
t(
Probt(
Xmin
Xmin
Xmax
Xmax
Xscl
Xscl
Ymin
Ymin
Ymax
Ymax
Yscl
Yscl
T
min
TThetamin
T
max
TThetamax
T
ptch
TThetaptch
Xfct
Xfct
Yfct
Yfct
DStart DStart
DEnd DEnd
Dpitch Dpitch
RightXmin
RightXmin
RightXmax
RightXmax
RightXscl
RightXscl
RightYmin
RightYmin
RightYmax
RightYmax
RightYscl
RightYscl
RightT
min
RightTThetamin
RightT
max
RightTThetamax
RightT
ptch
RightTThetaptch
c
Regression_c
d
Regression_d
e
Regression_e
Max(
Max(
Det Det
Arg Arg
Conjg Conjg
Commande Texte
ReP ReP
ImP ImP
d/d
x(
d/dx(
d
2
/dx
2
(
d^2/dx^2(
Solve(
Solve(
Σ(
Sigma(
FMin(
FMin(
FMax(
FMax(
Seq(
Seq(
Min(
Min(
Mean(
Mean(
Median(
Median(
SolveN(
SolveN(
MOD(
MOD(
MOD_Exp(
MOD_Exp(
GCD(
GCD(
LCM(
LCM(
StdDev(
StdDev(
Variance(
Variance(
Mat Mat
Trn Trn
¼Row ¼Row
¼Row+ ¼Row+
Row+ Row+
Swap Swap
Dim Dim
Fill(
Fill(
Identity Identity
Augment(
Augment(
List→Mat(
List->Mat(
Mat→List(
Mat->List(
Sum Sum
Prod Prod
Percent Percent
Cuml Cuml
i
Imaginary
List List
ΔList
Dlist
∞
Infinity
∠
Angle
Ref Ref
Rref Rref
'
Conv
SimCoef SimCoef
PlyCoef PlyCoef
SimResult SimResult
PlyResult PlyResult
n
Financialn
I%
FinancialI%
PV
FinancialPV
PMT
FinancialPMT
FV
FinancialFV
List1
List1
List2
List2
List3
List3