
Software Gebruiksaanwijzing
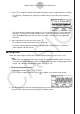


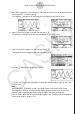


Table Of Contents
- Inhoud
- Eerste kennismaking — Lees dit eerst!
- Hoofdstuk 1 Basisbewerking
- Hoofdstuk 2 Manuele berekeningen
- 1. Basisberekeningen
- 2. Speciale functies
- 3. De hoekeenheid en weergave van getallen instellen
- 4. Berekeningen met wetenschappelijke functies
- 5. Numerieke berekeningen
- 6. Rekenen met complexe getallen
- 7. Berekeningen met gehele getallen in het twee-, acht-, tien- en zestientallige talstelsel
- 8. Matrixrekenen
- 9. Vectorberekeningen
- 10. Metrieke omzetting
- Hoofdstuk 3 Lijsten
- Hoofdstuk 4 Oplossen van vergelijkingen
- Hoofdstuk 5 Grafieken
- 1. Voorbeeldgrafieken
- 2. Controleren wat op een grafisch scherm wordt weergegeven
- 3. Een grafiek tekenen
- 4. Een grafiek in het afbeeldingsgeheugen opslaan
- 5. Twee grafieken op hetzelfde scherm tekenen
- 6. Handmatig tekenen
- 7. Tabellen gebruiken
- 8. Dynamisch tekenen
- 9. Een grafiek tekenen van een rijvoorschrift
- 10. Grafieken van kegelsneden tekenen
- 11. De weergave van een grafiek wijzigen
- 12. Functieanalyse
- Hoofdstuk 6 Statistische berekeningen en grafieken
- 1. Voor u met statistische berekeningen begint
- 2. Grafieken en berekeningen in verband met statistische waarnemingen met één variabele
- 3. Grafieken en berekeningen in verband met statistische waarnemingen met twee variabelen
- 4. Uitvoeren van statistische berekeningen
- 5. Testen
- 6. Betrouwbaarheidsinterval
- 7. Kansverdelingsfuncties
- 8. Invoer- en uitvoertermen van testen, betrouwbaarheidsinterval, en kansverdelingsfuncties
- 9. Statistische formule
- Hoofdstuk 7 Financiële berekeningen (TVM)
- 1. Voor u met financiële berekeningen begint
- 2. Enkelvoudige interest
- 3. Samengestelde interest
- 4. Evaluatie van een investering (Cash Flow)
- 5. Afschrijving
- 6. Omzetting van nominale rentevoet naar reële rentevoet
- 7. Berekening van kosten, verkoopprijs en winstmarge
- 8. Dag- en datumberekeningen
- 9. Devaluatie
- 10. Obligatieberekeningen
- 11. Financiële berekeningen met gebruik van functies
- Hoofdstuk 8 Programmeren
- Hoofdstuk 9 Spreadsheet
- Hoofdstuk 10 eActivity
- Hoofdstuk 11 Geheugenbeheerder
- Hoofdstuk 12 Systeembeheerder
- Hoofdstuk 13 Uitwisselen van gegevens
- Hoofdstuk 14 SD-kaarten en SDHC-kaarten gebruiken (alleen GRAPH95)
- Bijlage
- E-CON2 Application (English) (GRAPH35+ E)
- 1 E-CON2 Overview
- 2 Using the Setup Wizard
- 3 Using Advanced Setup
- 4 Using a Custom Probe
- 5 Using the MULTIMETER Mode
- 6 Using Setup Memory
- 7 Using Program Converter
- 8 Starting a Sampling Operation
- 9 Using Sample Data Memory
- 10 Using the Graph Analysis Tools to Graph Data
- 11 Graph Analysis Tool Graph Screen Operations
- 12 Calling E-CON2 Functions from an eActivity
- E-CON3 Application (English) (GRAPH95, GRAPH75+ E, GRAPH75+, GRAPH75)
- 1 E-CON3 Overview
- 2 Using the Setup Wizard
- 3 Using Advanced Setup
- 4 Using a Custom Probe
- 5 Using the MULTIMETER Mode
- 6 Using Setup Memory
- 7 Using Program Converter
- 8 Starting a Sampling Operation
- 9 Using Sample Data Memory
- 10 Using the Graph Analysis Tools to Graph Data
- 11 Graph Analysis Tool Graph Screen Operations
- 12 Calling E-CON3 Functions from an eActivity
3. Press w.
• This causes the magnifying glass to disappear and enters the zoom mode.
• The cursor keys perform the following operations in the zoom mode.
To do this: Press this cursor key:
Enlarge the graph image horizontally
e
Reduce the size of the graph image horizontally
d
Enlarge the graph image vertically
f
Reduce the size of the graph image vertically
c
4. To exit the zoom mode, press J.
k Transforming Sampled Data to List Data
Use the following procedure to transform the sampled data in a specific range of a graph into
list data.
u
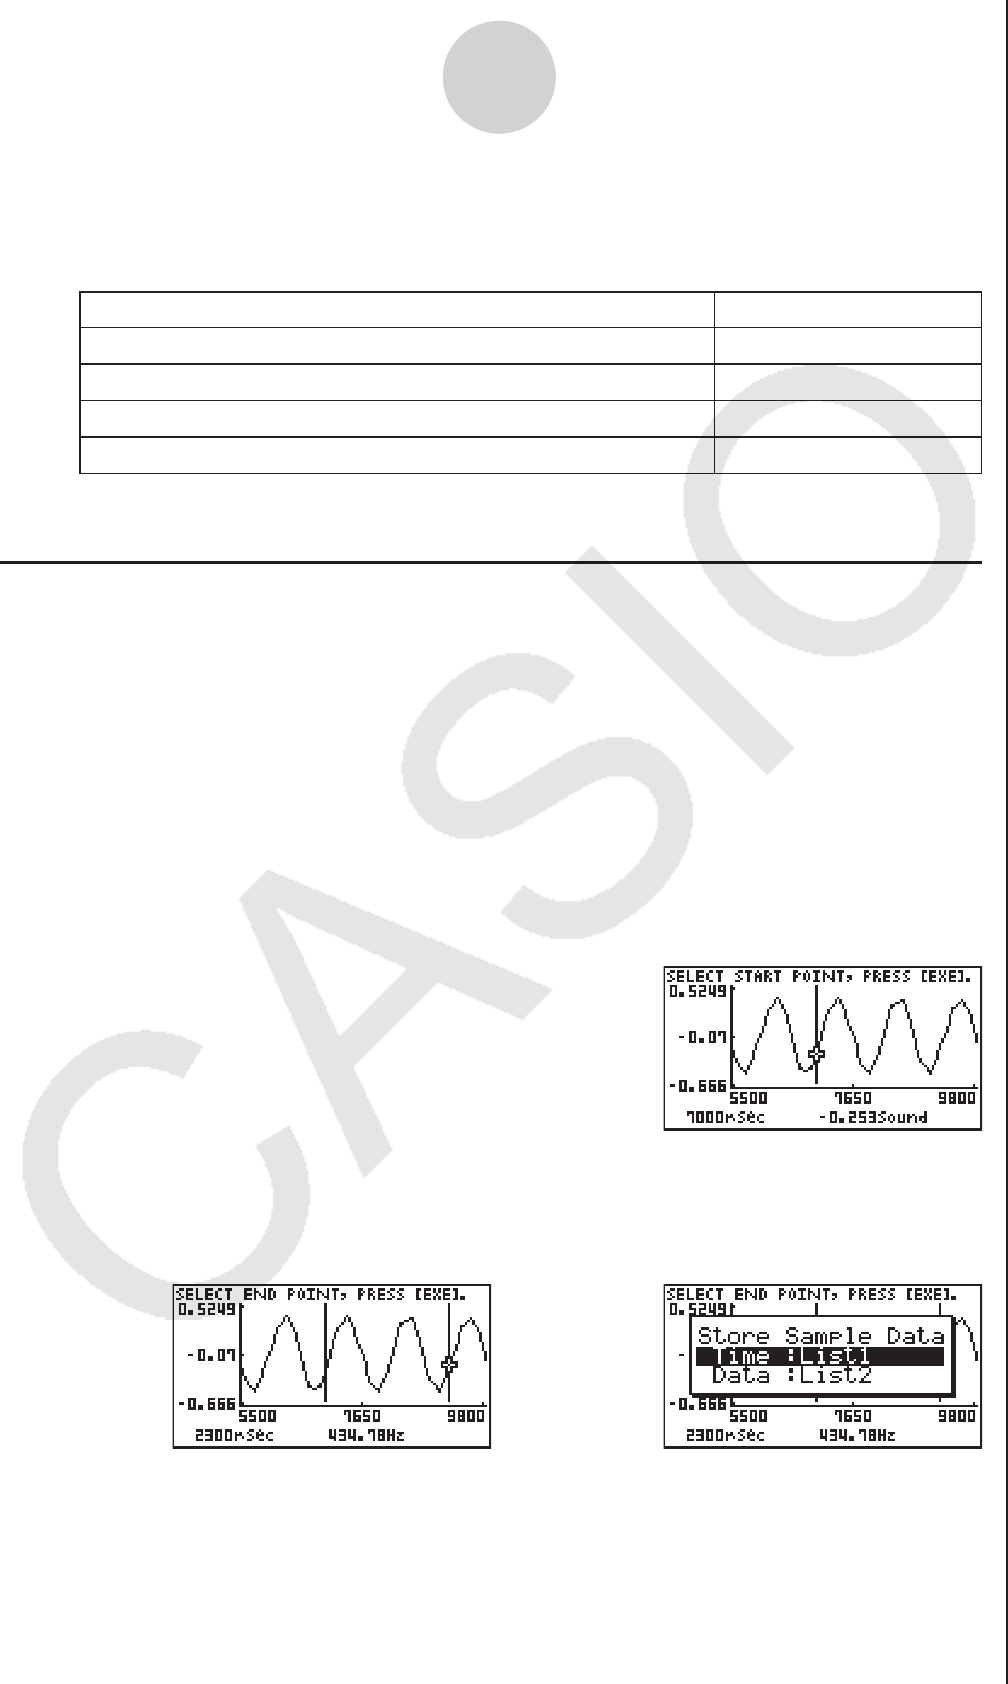
To transform sampled data to list data
1. On the graph screen, press K, and then 2(LMEM).
• This displays the [LMEM] menu.
2. Press 2(SEL).
• This displays the trace pointer for selecting the range on the graph.
3. Move the trace pointer to the start point of the range you want to convert to list data, and
then press w.
4. Move the trace pointer to the end point of the range you want to convert to list data, and
then press w.
• This displays a dialog box for specifying the lists where you want to store the time data
and the sampled data.
/
• The initial default lists are List 1 for the time and List 2 for sample data. To change to
another list (List 1 to List 26), use the up and down cursor keys to move the highlighting
to the list you want to change, and then input the applicable list number.
11-5
Graph Analysis Tool Graph Screen Operations