
Software Gebruiksaanwijzing
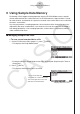


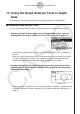


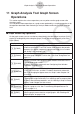


Table Of Contents
- Inhoud
- Eerste kennismaking — Lees dit eerst!
- Hoofdstuk 1 Basisbewerking
- Hoofdstuk 2 Manuele berekeningen
- 1. Basisberekeningen
- 2. Speciale functies
- 3. De hoekeenheid en weergave van getallen instellen
- 4. Berekeningen met wetenschappelijke functies
- 5. Numerieke berekeningen
- 6. Rekenen met complexe getallen
- 7. Berekeningen met gehele getallen in het twee-, acht-, tien- en zestientallige talstelsel
- 8. Matrixrekenen
- 9. Vectorberekeningen
- 10. Metrieke omzetting
- Hoofdstuk 3 Lijsten
- Hoofdstuk 4 Oplossen van vergelijkingen
- Hoofdstuk 5 Grafieken
- 1. Voorbeeldgrafieken
- 2. Controleren wat op een grafisch scherm wordt weergegeven
- 3. Een grafiek tekenen
- 4. Een grafiek in het afbeeldingsgeheugen opslaan
- 5. Twee grafieken op hetzelfde scherm tekenen
- 6. Handmatig tekenen
- 7. Tabellen gebruiken
- 8. Dynamisch tekenen
- 9. Een grafiek tekenen van een rijvoorschrift
- 10. Grafieken van kegelsneden tekenen
- 11. De weergave van een grafiek wijzigen
- 12. Functieanalyse
- Hoofdstuk 6 Statistische berekeningen en grafieken
- 1. Voor u met statistische berekeningen begint
- 2. Grafieken en berekeningen in verband met statistische waarnemingen met één variabele
- 3. Grafieken en berekeningen in verband met statistische waarnemingen met twee variabelen
- 4. Uitvoeren van statistische berekeningen
- 5. Testen
- 6. Betrouwbaarheidsinterval
- 7. Kansverdelingsfuncties
- 8. Invoer- en uitvoertermen van testen, betrouwbaarheidsinterval, en kansverdelingsfuncties
- 9. Statistische formule
- Hoofdstuk 7 Financiële berekeningen (TVM)
- 1. Voor u met financiële berekeningen begint
- 2. Enkelvoudige interest
- 3. Samengestelde interest
- 4. Evaluatie van een investering (Cash Flow)
- 5. Afschrijving
- 6. Omzetting van nominale rentevoet naar reële rentevoet
- 7. Berekening van kosten, verkoopprijs en winstmarge
- 8. Dag- en datumberekeningen
- 9. Devaluatie
- 10. Obligatieberekeningen
- 11. Financiële berekeningen met gebruik van functies
- Hoofdstuk 8 Programmeren
- Hoofdstuk 9 Spreadsheet
- Hoofdstuk 10 eActivity
- Hoofdstuk 11 Geheugenbeheerder
- Hoofdstuk 12 Systeembeheerder
- Hoofdstuk 13 Uitwisselen van gegevens
- Hoofdstuk 14 SD-kaarten en SDHC-kaarten gebruiken (alleen GRAPH95)
- Bijlage
- E-CON2 Application (English) (GRAPH35+ E)
- 1 E-CON2 Overview
- 2 Using the Setup Wizard
- 3 Using Advanced Setup
- 4 Using a Custom Probe
- 5 Using the MULTIMETER Mode
- 6 Using Setup Memory
- 7 Using Program Converter
- 8 Starting a Sampling Operation
- 9 Using Sample Data Memory
- 10 Using the Graph Analysis Tools to Graph Data
- 11 Graph Analysis Tool Graph Screen Operations
- 12 Calling E-CON2 Functions from an eActivity
- E-CON3 Application (English) (GRAPH95, GRAPH75+ E, GRAPH75+, GRAPH75)
- 1 E-CON3 Overview
- 2 Using the Setup Wizard
- 3 Using Advanced Setup
- 4 Using a Custom Probe
- 5 Using the MULTIMETER Mode
- 6 Using Setup Memory
- 7 Using Program Converter
- 8 Starting a Sampling Operation
- 9 Using Sample Data Memory
- 10 Using the Graph Analysis Tools to Graph Data
- 11 Graph Analysis Tool Graph Screen Operations
- 12 Calling E-CON3 Functions from an eActivity
k Selecting an Analysis Mode and Drawing a Graph
This section contains a detailed procedure that covers all steps from selecting an analysis
mode to drawing a graph.
Note
• Step 4 through step 6 are not essential and may be skipped, if you want. Skipping any
step automatically applies the initial default values for its settings.
• If you skip step 2, the default analysis mode is the one whose name is displayed in the
top line of the Graph Mode screen.
u
To select an analysis mode and draw a graph
1. On the E-CON3 main menu (page 1-1), press 5(GRPH).
• This displays the Graph Mode screen.
2. Press 3(MODE), and then select the analysis mode you want from the menu that
appears.
To do this:
Perform this menu
operation:
To select this
mode:
Graph three sets of sampled data
simultaneously
[Norm] Graph Analysis
Graph sampled data along with its first and
second derivative graph
[diff] d/dt & d
2
/dt
2
Display the graphs of different sampled data
in upper and lower windows for comparison
[CMPR]/[GRPH]
Compare Graph
Output sampled data from the speaker,
displaying graph of the raw data in the upper
window and the output waveform in the lower
window (EA-200 only)
[CMPR]/[Snd]
Compare Sound
Display the graph of sampled data in the
upper window and its first derivative graph in
the lower window
[CMPR]/[d/dt]
Compare d/dt
Display the graph of sampled data in the
upper window and its second derivative
graph in the lower window
[CMPR]/[d
2
/dt
2
]
Compare d
2
/dt
2
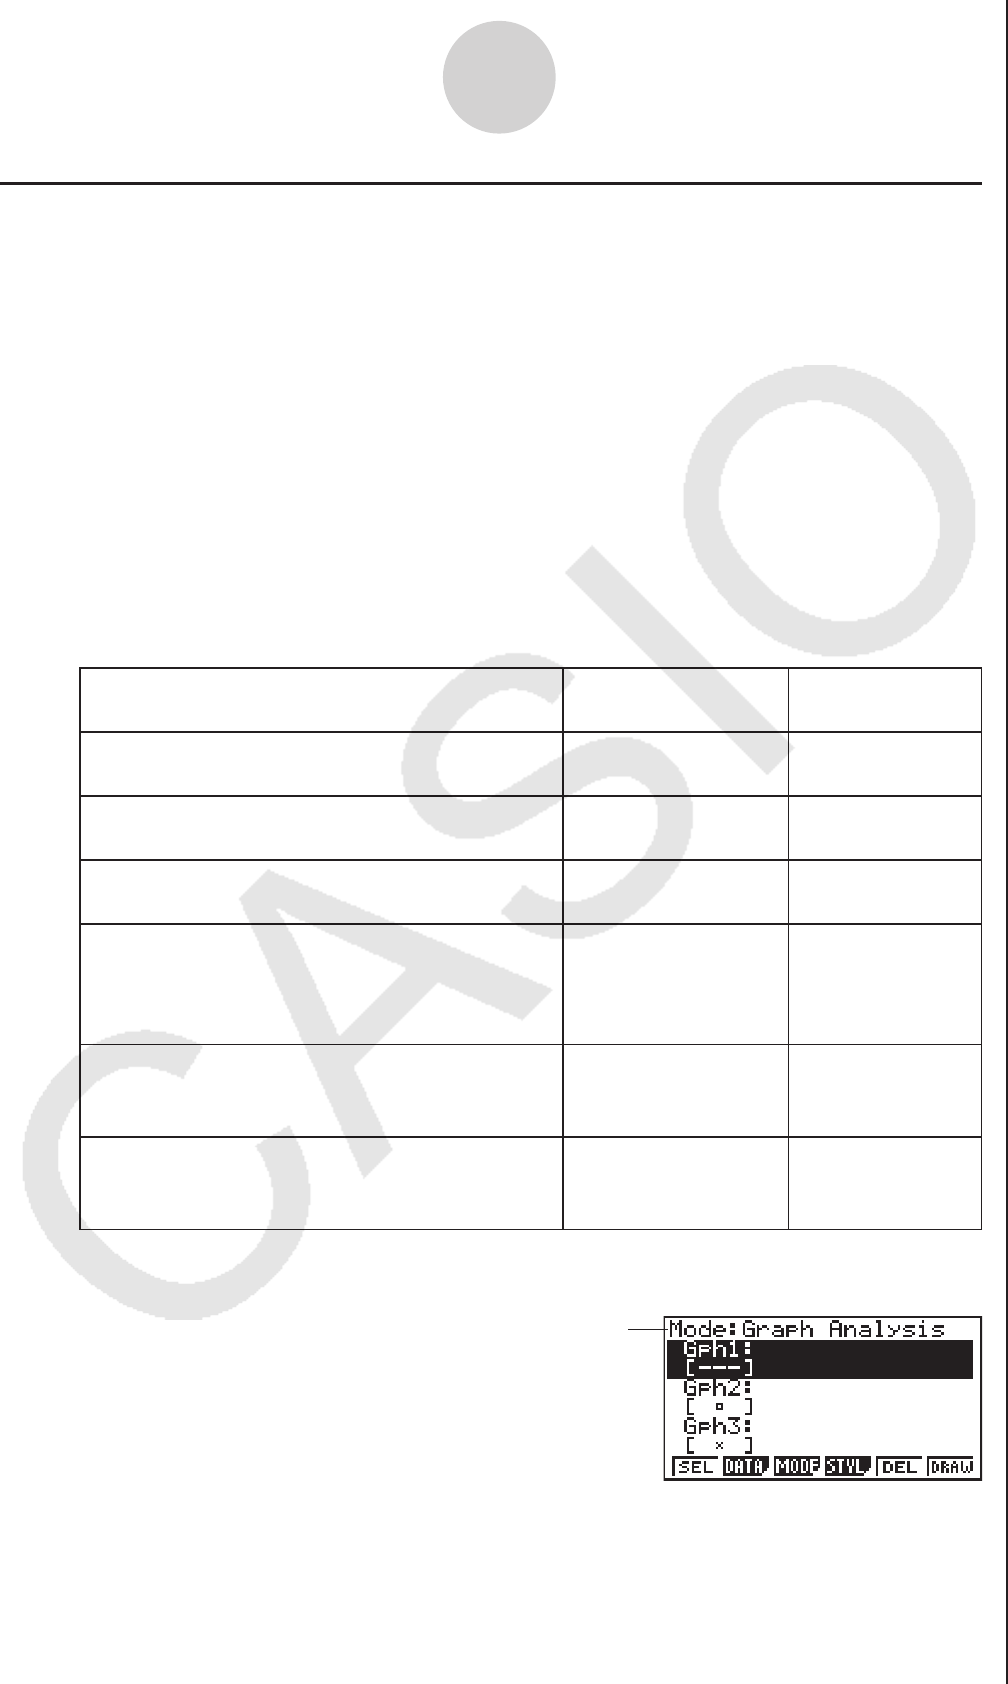
• The name of the currently selected mode appears in the top line of the Graph Mode
screen.
Analysis mode name
3. Press 2(DATA).
• This displays the Sampling Data List screen.
10-2
Using the Graph Analysis Tools to Graph Data