
Software Gebruiksaanwijzing
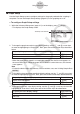

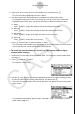
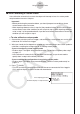


Table Of Contents
- Inhoud
- Eerste kennismaking — Lees dit eerst!
- Hoofdstuk 1 Basisbewerking
- Hoofdstuk 2 Manuele berekeningen
- 1. Basisberekeningen
- 2. Speciale functies
- 3. De hoekeenheid en weergave van getallen instellen
- 4. Berekeningen met wetenschappelijke functies
- 5. Numerieke berekeningen
- 6. Rekenen met complexe getallen
- 7. Berekeningen met gehele getallen in het twee-, acht-, tien- en zestientallige talstelsel
- 8. Matrixrekenen
- 9. Vectorberekeningen
- 10. Metrieke omzetting
- Hoofdstuk 3 Lijsten
- Hoofdstuk 4 Oplossen van vergelijkingen
- Hoofdstuk 5 Grafieken
- 1. Voorbeeldgrafieken
- 2. Controleren wat op een grafisch scherm wordt weergegeven
- 3. Een grafiek tekenen
- 4. Een grafiek in het afbeeldingsgeheugen opslaan
- 5. Twee grafieken op hetzelfde scherm tekenen
- 6. Handmatig tekenen
- 7. Tabellen gebruiken
- 8. Dynamisch tekenen
- 9. Een grafiek tekenen van een rijvoorschrift
- 10. Grafieken van kegelsneden tekenen
- 11. De weergave van een grafiek wijzigen
- 12. Functieanalyse
- Hoofdstuk 6 Statistische berekeningen en grafieken
- 1. Voor u met statistische berekeningen begint
- 2. Grafieken en berekeningen in verband met statistische waarnemingen met één variabele
- 3. Grafieken en berekeningen in verband met statistische waarnemingen met twee variabelen
- 4. Uitvoeren van statistische berekeningen
- 5. Testen
- 6. Betrouwbaarheidsinterval
- 7. Kansverdelingsfuncties
- 8. Invoer- en uitvoertermen van testen, betrouwbaarheidsinterval, en kansverdelingsfuncties
- 9. Statistische formule
- Hoofdstuk 7 Financiële berekeningen (TVM)
- 1. Voor u met financiële berekeningen begint
- 2. Enkelvoudige interest
- 3. Samengestelde interest
- 4. Evaluatie van een investering (Cash Flow)
- 5. Afschrijving
- 6. Omzetting van nominale rentevoet naar reële rentevoet
- 7. Berekening van kosten, verkoopprijs en winstmarge
- 8. Dag- en datumberekeningen
- 9. Devaluatie
- 10. Obligatieberekeningen
- 11. Financiële berekeningen met gebruik van functies
- Hoofdstuk 8 Programmeren
- Hoofdstuk 9 Spreadsheet
- Hoofdstuk 10 eActivity
- Hoofdstuk 11 Geheugenbeheerder
- Hoofdstuk 12 Systeembeheerder
- Hoofdstuk 13 Uitwisselen van gegevens
- Hoofdstuk 14 SD-kaarten en SDHC-kaarten gebruiken (alleen GRAPH95)
- Bijlage
- E-CON2 Application (English) (GRAPH35+ E)
- 1 E-CON2 Overview
- 2 Using the Setup Wizard
- 3 Using Advanced Setup
- 4 Using a Custom Probe
- 5 Using the MULTIMETER Mode
- 6 Using Setup Memory
- 7 Using Program Converter
- 8 Starting a Sampling Operation
- 9 Using Sample Data Memory
- 10 Using the Graph Analysis Tools to Graph Data
- 11 Graph Analysis Tool Graph Screen Operations
- 12 Calling E-CON2 Functions from an eActivity
- E-CON3 Application (English) (GRAPH95, GRAPH75+ E, GRAPH75+, GRAPH75)
- 1 E-CON3 Overview
- 2 Using the Setup Wizard
- 3 Using Advanced Setup
- 4 Using a Custom Probe
- 5 Using the MULTIMETER Mode
- 6 Using Setup Memory
- 7 Using Program Converter
- 8 Starting a Sampling Operation
- 9 Using Sample Data Memory
- 10 Using the Graph Analysis Tools to Graph Data
- 11 Graph Analysis Tool Graph Screen Operations
- 12 Calling E-CON3 Functions from an eActivity
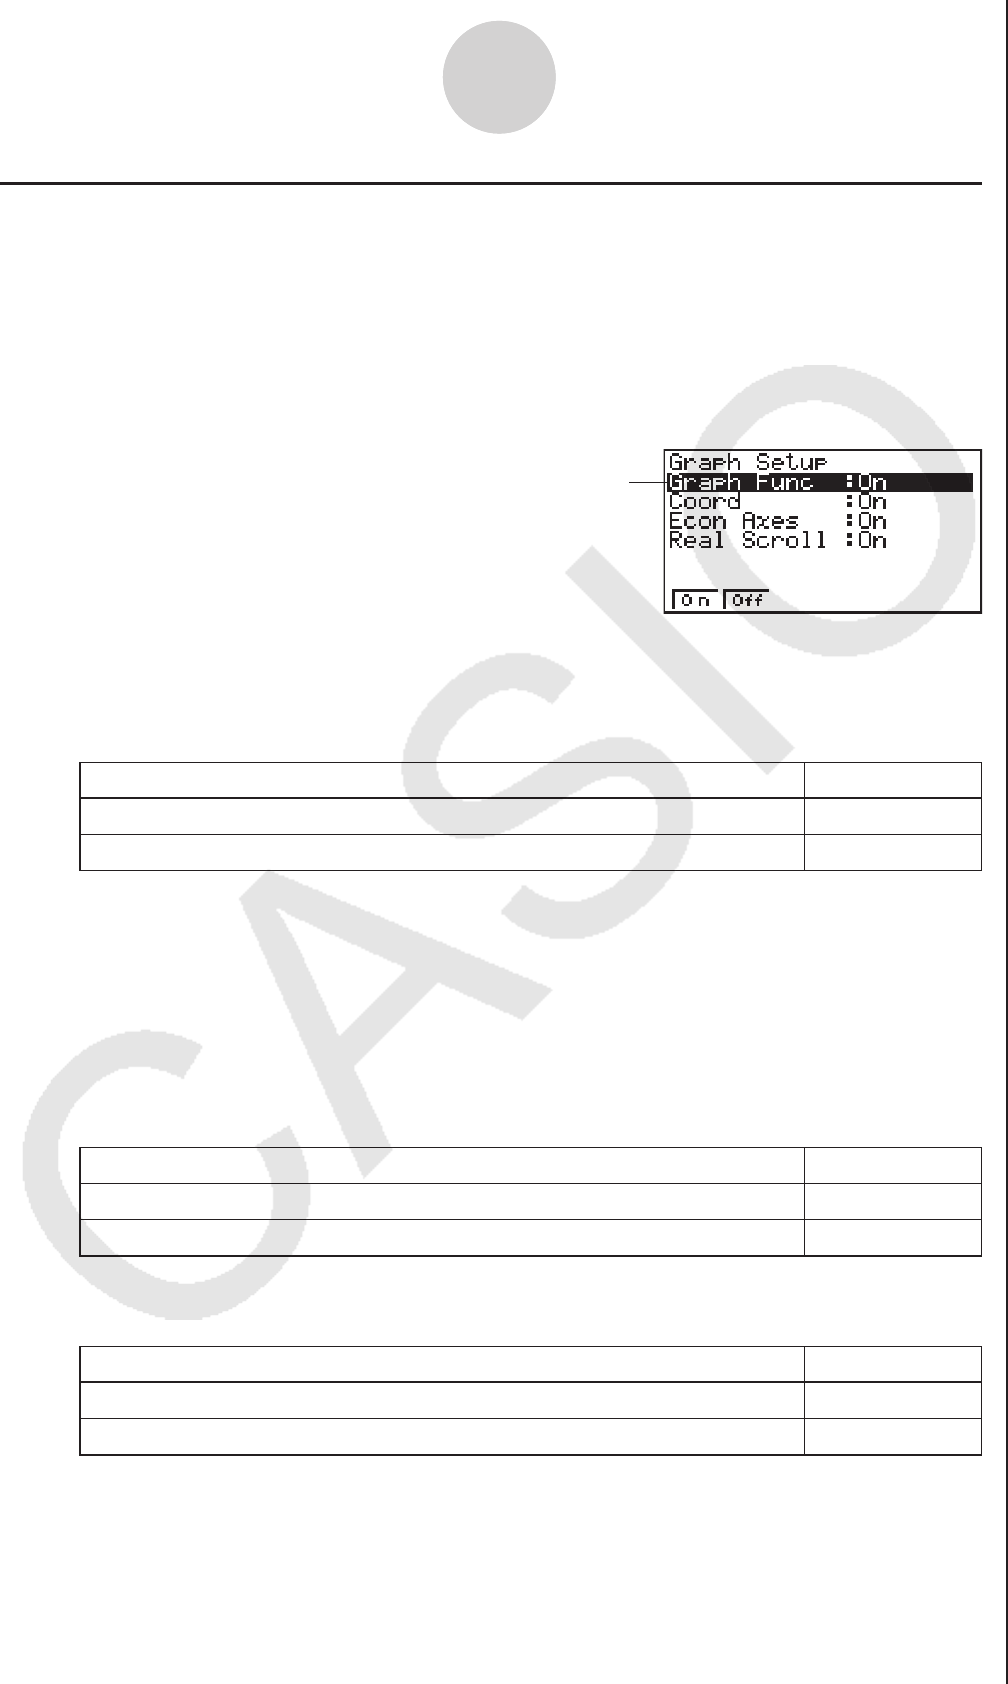
k Graph Setup
Use the Graph Setup screen to configure settings for the graph produced after sampling is
complete. You use the Sample Setup settings (page 3-5) to turn graphing on or off.
u
To configure Graph Setup settings
1. While the Advanced Setup menu (page 3-1) is on the display, press e(Graph).
• This displays the Graph Setup screen.
Currently selected item
Graph Setup Screen
2. To change the graph source data name display setting, use the f and c cursor keys
to move the highlighting to “Graph Func”. Next, press one of the function keys described
below.
To specify this graph source data name display setting: Press this key:
Display source data name
1(On)
Hide source data name
2(Off)
• When the graph data is stored in a sample data memory file, the file name appears as
the source data name. When the graph data is stored in current data area, the channel
name appears.
Note
• For details about sample data memory and current data area, see “9 Using Sample Data
Memory”.
3. To change the trace operation coordinate display setting, use the f and c cursor keys
to move the highlighting to “Coord”. Next, press one of the function keys described below.
To specify this coordinate display setting for the trace operation: Press this key:
Display trace coordinates
1(On)
Hide trace coordinates
2(Off)
4. To change the numeric axes display setting, use the f and c cursor keys to move the
highlighting to “Econ Axes”. Next, press one of the function keys described below.
To specify this axes display setting: Press this key:
Display axes
1(On)
Hide axes
2(Off)
3-13
Using Advanced Setup