
Software Gebruiksaanwijzing


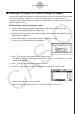
Table Of Contents
- Inhoud
- Eerste kennismaking — Lees dit eerst!
- Hoofdstuk 1 Basisbewerking
- Hoofdstuk 2 Manuele berekeningen
- 1. Basisberekeningen
- 2. Speciale functies
- 3. De hoekeenheid en weergave van getallen instellen
- 4. Berekeningen met wetenschappelijke functies
- 5. Numerieke berekeningen
- 6. Rekenen met complexe getallen
- 7. Berekeningen met gehele getallen in het twee-, acht-, tien- en zestientallige talstelsel
- 8. Matrixrekenen
- 9. Vectorberekeningen
- 10. Metrieke omzetting
- Hoofdstuk 3 Lijsten
- Hoofdstuk 4 Oplossen van vergelijkingen
- Hoofdstuk 5 Grafieken
- 1. Voorbeeldgrafieken
- 2. Controleren wat op een grafisch scherm wordt weergegeven
- 3. Een grafiek tekenen
- 4. Een grafiek in het afbeeldingsgeheugen opslaan
- 5. Twee grafieken op hetzelfde scherm tekenen
- 6. Handmatig tekenen
- 7. Tabellen gebruiken
- 8. Dynamisch tekenen
- 9. Een grafiek tekenen van een rijvoorschrift
- 10. Grafieken van kegelsneden tekenen
- 11. De weergave van een grafiek wijzigen
- 12. Functieanalyse
- Hoofdstuk 6 Statistische berekeningen en grafieken
- 1. Voor u met statistische berekeningen begint
- 2. Grafieken en berekeningen in verband met statistische waarnemingen met één variabele
- 3. Grafieken en berekeningen in verband met statistische waarnemingen met twee variabelen
- 4. Uitvoeren van statistische berekeningen
- 5. Testen
- 6. Betrouwbaarheidsinterval
- 7. Kansverdelingsfuncties
- 8. Invoer- en uitvoertermen van testen, betrouwbaarheidsinterval, en kansverdelingsfuncties
- 9. Statistische formule
- Hoofdstuk 7 Financiële berekeningen (TVM)
- 1. Voor u met financiële berekeningen begint
- 2. Enkelvoudige interest
- 3. Samengestelde interest
- 4. Evaluatie van een investering (Cash Flow)
- 5. Afschrijving
- 6. Omzetting van nominale rentevoet naar reële rentevoet
- 7. Berekening van kosten, verkoopprijs en winstmarge
- 8. Dag- en datumberekeningen
- 9. Devaluatie
- 10. Obligatieberekeningen
- 11. Financiële berekeningen met gebruik van functies
- Hoofdstuk 8 Programmeren
- Hoofdstuk 9 Spreadsheet
- Hoofdstuk 10 eActivity
- Hoofdstuk 11 Geheugenbeheerder
- Hoofdstuk 12 Systeembeheerder
- Hoofdstuk 13 Uitwisselen van gegevens
- Hoofdstuk 14 SD-kaarten en SDHC-kaarten gebruiken (alleen GRAPH95)
- Bijlage
- E-CON2 Application (English) (GRAPH35+ E)
- 1 E-CON2 Overview
- 2 Using the Setup Wizard
- 3 Using Advanced Setup
- 4 Using a Custom Probe
- 5 Using the MULTIMETER Mode
- 6 Using Setup Memory
- 7 Using Program Converter
- 8 Starting a Sampling Operation
- 9 Using Sample Data Memory
- 10 Using the Graph Analysis Tools to Graph Data
- 11 Graph Analysis Tool Graph Screen Operations
- 12 Calling E-CON2 Functions from an eActivity
- E-CON3 Application (English) (GRAPH95, GRAPH75+ E, GRAPH75+, GRAPH75)
- 1 E-CON3 Overview
- 2 Using the Setup Wizard
- 3 Using Advanced Setup
- 4 Using a Custom Probe
- 5 Using the MULTIMETER Mode
- 6 Using Setup Memory
- 7 Using Program Converter
- 8 Starting a Sampling Operation
- 9 Using Sample Data Memory
- 10 Using the Graph Analysis Tools to Graph Data
- 11 Graph Analysis Tool Graph Screen Operations
- 12 Calling E-CON3 Functions from an eActivity
2-8
Using the Setup Wizard
k Outputting the Waveform of a Function through the Speaker
Normally, the Setup Wizard helps you configure setups for sensors connected to the EA-200.
If you select [CASIO] - [Speaker] - [y=f(x)] on the “Select Sensor” screen, however, it
configures the EA-200 to output the sound that corresponds to a function that you input and
graph on the calculator.
uu
uu
u
To configure a setup for speaker output
1. Connect the data communication cable (SB-62) to the communication port of the
calculator and the MASTER port of the EA-200.
2. Perform the first two steps of the procedure under “To configure an EA-200 setup using
Setup Wizard” on page 2-2.
3. On the “Select Sensor” screen, select [CASIO] - [Speaker] - [y=f(x)].
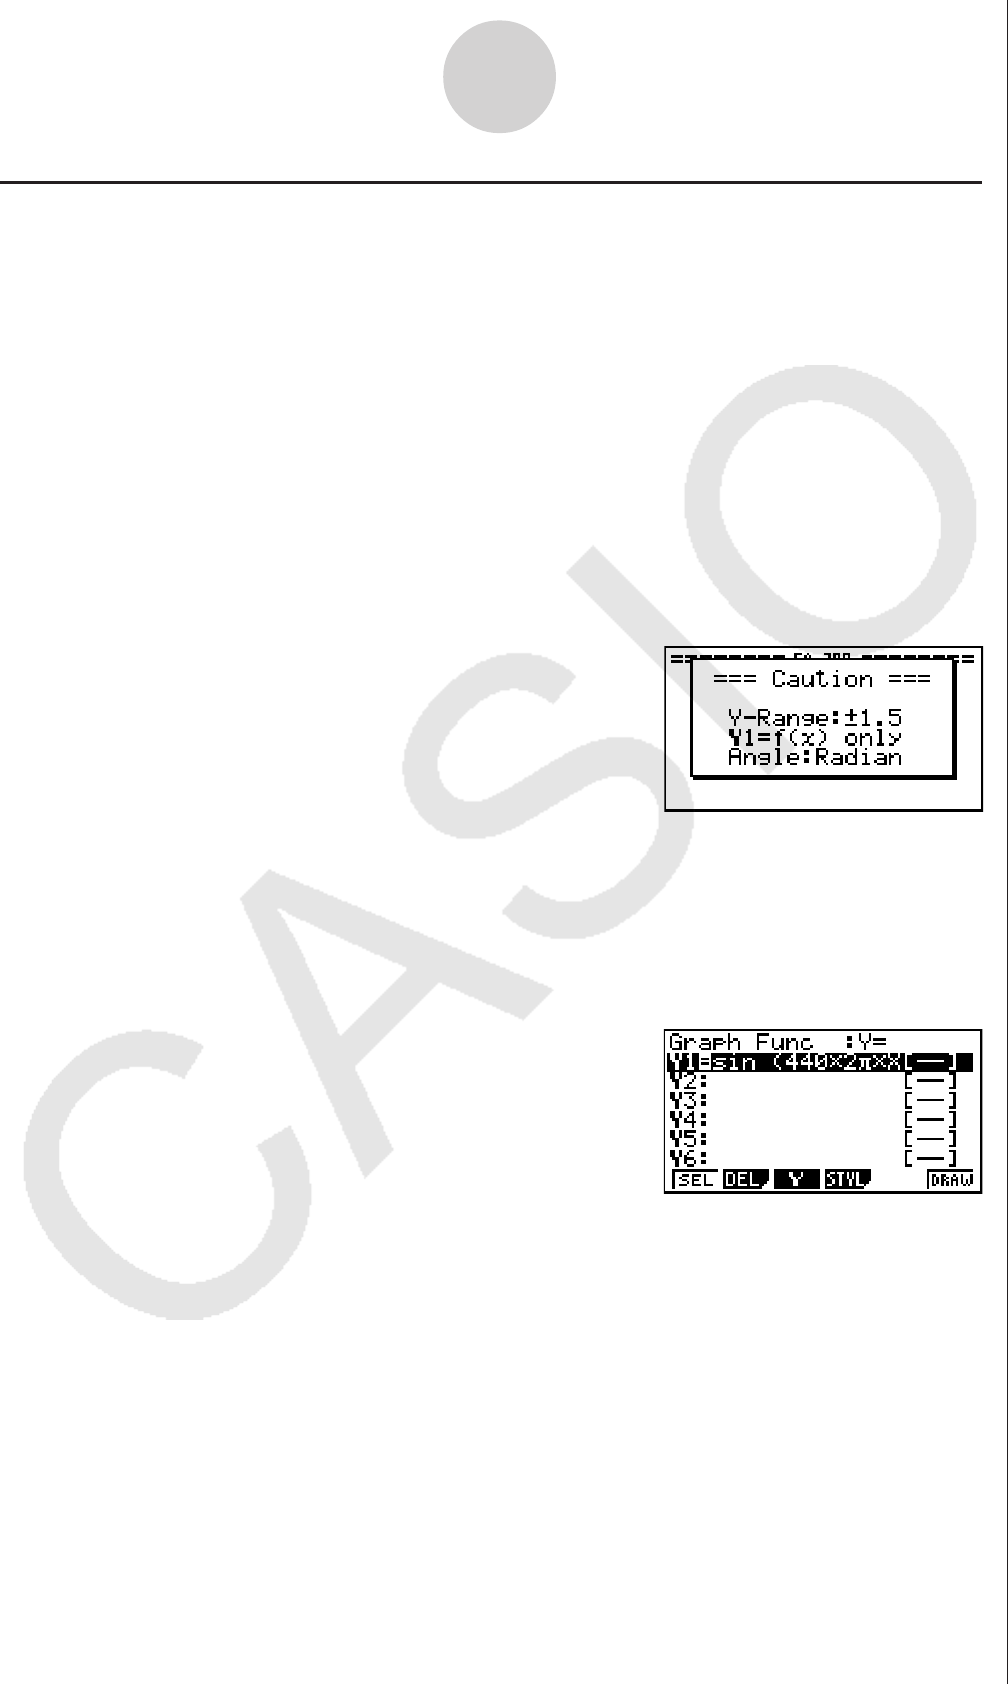
This displays a screen like the one shown below.
4. Press w to advance to the View Window setting screen.
• The following settings are configured automatically: Ymin = –1.5 and Ymax = 1.5. Do not
change these settings.
5. Press w or J to advance to the graph function list.
6. In line “Y1”, input the function of the waveform for the sound you want to input.
• Note that the angle unit is always radians.
• Input a function where the value of “Y” is within the range of –1.5 to +1.5.