
Software Gebruiksaanwijzing


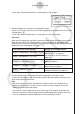


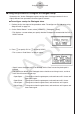

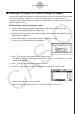
Table Of Contents
- Inhoud
- Eerste kennismaking — Lees dit eerst!
- Hoofdstuk 1 Basisbewerking
- Hoofdstuk 2 Manuele berekeningen
- 1. Basisberekeningen
- 2. Speciale functies
- 3. De hoekeenheid en weergave van getallen instellen
- 4. Berekeningen met wetenschappelijke functies
- 5. Numerieke berekeningen
- 6. Rekenen met complexe getallen
- 7. Berekeningen met gehele getallen in het twee-, acht-, tien- en zestientallige talstelsel
- 8. Matrixrekenen
- 9. Vectorberekeningen
- 10. Metrieke omzetting
- Hoofdstuk 3 Lijsten
- Hoofdstuk 4 Oplossen van vergelijkingen
- Hoofdstuk 5 Grafieken
- 1. Voorbeeldgrafieken
- 2. Controleren wat op een grafisch scherm wordt weergegeven
- 3. Een grafiek tekenen
- 4. Een grafiek in het afbeeldingsgeheugen opslaan
- 5. Twee grafieken op hetzelfde scherm tekenen
- 6. Handmatig tekenen
- 7. Tabellen gebruiken
- 8. Dynamisch tekenen
- 9. Een grafiek tekenen van een rijvoorschrift
- 10. Grafieken van kegelsneden tekenen
- 11. De weergave van een grafiek wijzigen
- 12. Functieanalyse
- Hoofdstuk 6 Statistische berekeningen en grafieken
- 1. Voor u met statistische berekeningen begint
- 2. Grafieken en berekeningen in verband met statistische waarnemingen met één variabele
- 3. Grafieken en berekeningen in verband met statistische waarnemingen met twee variabelen
- 4. Uitvoeren van statistische berekeningen
- 5. Testen
- 6. Betrouwbaarheidsinterval
- 7. Kansverdelingsfuncties
- 8. Invoer- en uitvoertermen van testen, betrouwbaarheidsinterval, en kansverdelingsfuncties
- 9. Statistische formule
- Hoofdstuk 7 Financiële berekeningen (TVM)
- 1. Voor u met financiële berekeningen begint
- 2. Enkelvoudige interest
- 3. Samengestelde interest
- 4. Evaluatie van een investering (Cash Flow)
- 5. Afschrijving
- 6. Omzetting van nominale rentevoet naar reële rentevoet
- 7. Berekening van kosten, verkoopprijs en winstmarge
- 8. Dag- en datumberekeningen
- 9. Devaluatie
- 10. Obligatieberekeningen
- 11. Financiële berekeningen met gebruik van functies
- Hoofdstuk 8 Programmeren
- Hoofdstuk 9 Spreadsheet
- Hoofdstuk 10 eActivity
- Hoofdstuk 11 Geheugenbeheerder
- Hoofdstuk 12 Systeembeheerder
- Hoofdstuk 13 Uitwisselen van gegevens
- Hoofdstuk 14 SD-kaarten en SDHC-kaarten gebruiken (alleen GRAPH95)
- Bijlage
- E-CON2 Application (English) (GRAPH35+ E)
- 1 E-CON2 Overview
- 2 Using the Setup Wizard
- 3 Using Advanced Setup
- 4 Using a Custom Probe
- 5 Using the MULTIMETER Mode
- 6 Using Setup Memory
- 7 Using Program Converter
- 8 Starting a Sampling Operation
- 9 Using Sample Data Memory
- 10 Using the Graph Analysis Tools to Graph Data
- 11 Graph Analysis Tool Graph Screen Operations
- 12 Calling E-CON2 Functions from an eActivity
- E-CON3 Application (English) (GRAPH95, GRAPH75+ E, GRAPH75+, GRAPH75)
- 1 E-CON3 Overview
- 2 Using the Setup Wizard
- 3 Using Advanced Setup
- 4 Using a Custom Probe
- 5 Using the MULTIMETER Mode
- 6 Using Setup Memory
- 7 Using Program Converter
- 8 Starting a Sampling Operation
- 9 Using Sample Data Memory
- 10 Using the Graph Analysis Tools to Graph Data
- 11 Graph Analysis Tool Graph Screen Operations
- 12 Calling E-CON3 Functions from an eActivity
2-3
Using the Setup Wizard
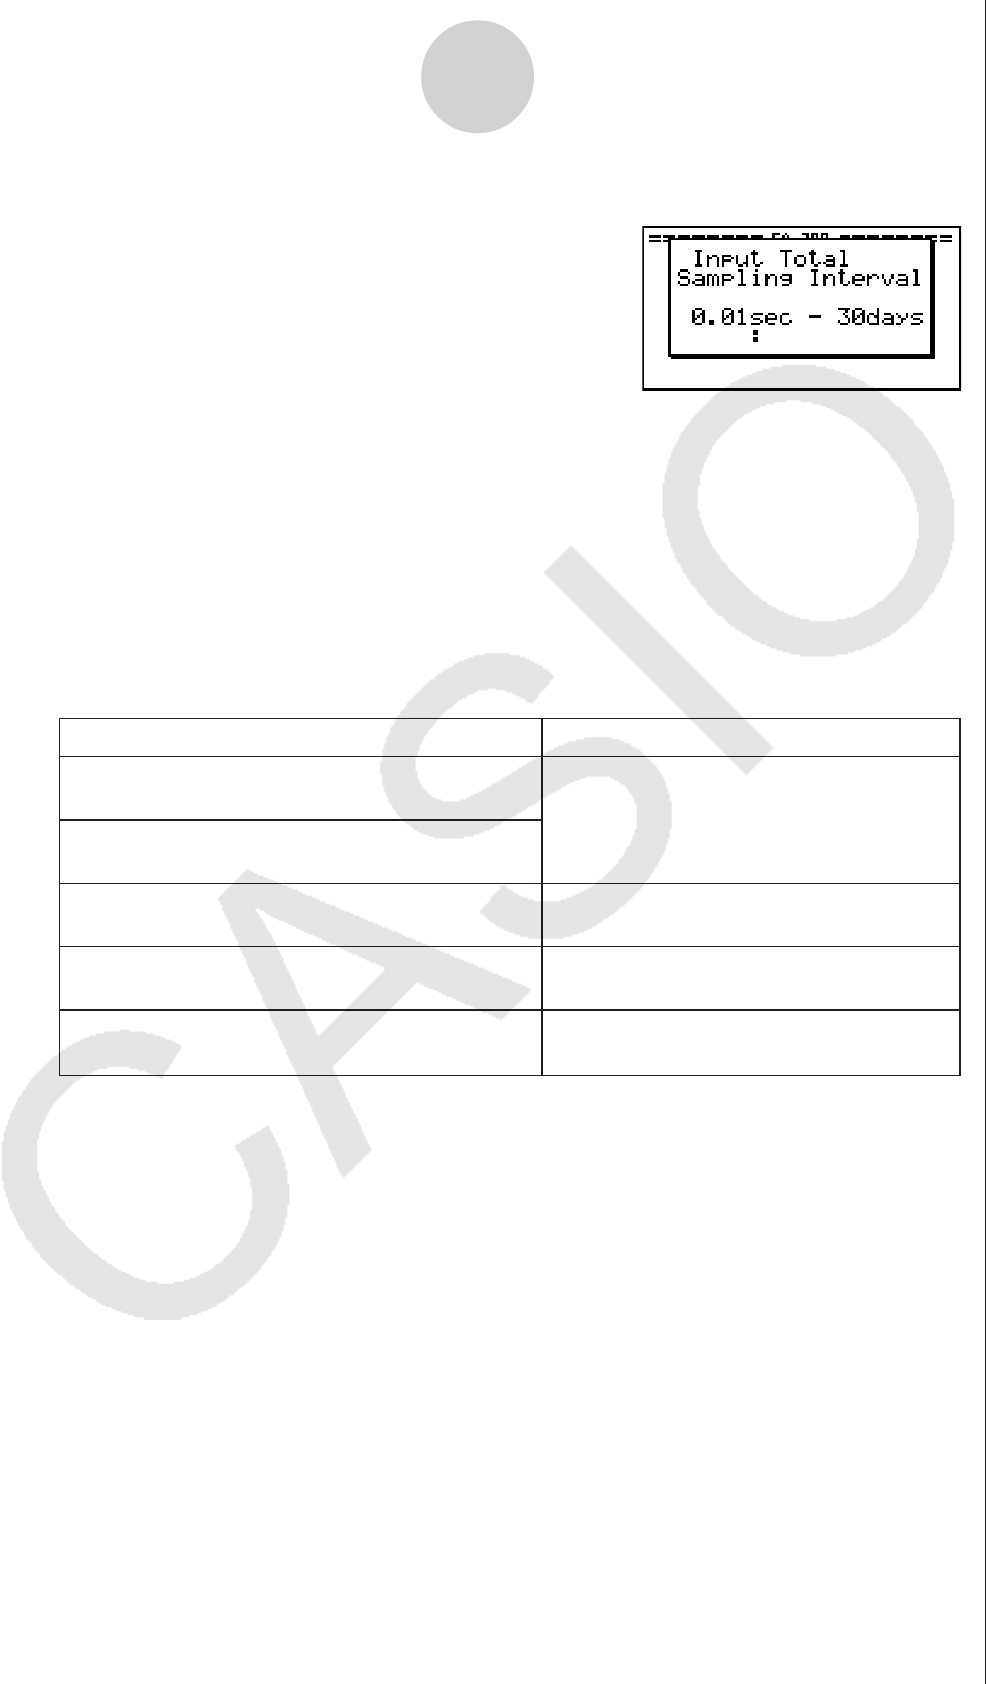
• If the “Input Total Sampling Interval” screen appears, skip to step 6.
5. Select the options for the sensor you specified in step 4.
Use the f and c cursor keys to move the highlighting to the option you want to select,
and then press w.
• If the “Input Total Sampling Interval” screen appears, advance to step 6.
Important!
When special settings are required by the sensor and/or option you select, other screens
other than the “Input Total Sampling Interval” screen will appear on the display. The
following shows where you should go to find information about the operations you need to
perform for each sensor/option selection.
6. Use the number input keys to input the total sampling time. Just input a value.
In step 8 of this procedure, you will be able to specify the unit (seconds, minutes, hours,
days) of the value you input here.
Note
• With some sensors ([CASIO] - [Microphone] - [Sound wave], etc.) sampling time is
limited to a few seconds. The unit for such a sensor is always seconds, and so the
“Select Unit” screen does not appear.
• If you specify a total sampling time value in the range of 10 seconds to 23 hours, 59
minutes, 59 seconds, real-time graphing will be performed during sampling. This is the
same as selecting the Realtime Mode on the “Advanced Setup” screen.
If you select this sensor/option: Go here for more information:
[CASIO] - [Microphone] - [Sound wave & FFT]
[CASIO] - [Microphone] - [FFT only]
[VERNIER] - [Photogate] - [Gate]
“To configure a setup for Photogate
alone” on page 2-6
[VERNIER] - [Photogate] - [Pulley]
“To configure a setup for Photogate and
Smart Pulley” on page 2-7
[CASIO] - [Speaker] - [y=f(x)]
“Outputting the Waveform of a Function
through the Speaker” on page 2-8
“Using Setup Wizard to Configure
Settings for FFT (Frequency
Characteristics) Data Sampling” on
page 2-5