
Versão 3.10 do Software Guia do Usuário


ε-49
Graph Analysis Tool Graph Screen Operations
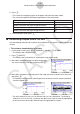
3. Move the trace pointer to the end point of the range you want to output from the speaker,
and then press w.
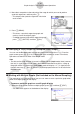
• After you specify the start point and end point, an output frequency dialog box shown
below appears on the display.
→
4. Input a percent value for the output frequency value you want.
• The output frequency specification is a percent value. To output the original sound as-is,
specify 100%. To raise the original sound by one octave, input a value of 200%. To
lower the original sound by one octave, input a value of 50%.
5. After inputting an output frequency value, press w.
• This outputs the waveform between the start point and end point from the EA-200
speaker.
• If the sound you configured cannot be output for some reason, the message “Range
Error” will appear. If this happens, press J to scroll back through the previous setting
screens and change the setup as required.
6. To terminate sound output, press the EA-200 [START/STOP] key.
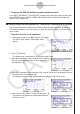
7. Press w.
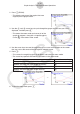
• This displays a screen like the one shown nearby.
8. If you want to retry output from the speaker, press 1(Yes). To exit the procedure and
return to the graph screen, press 6(No).
• Pressing 1(Yes) returns to the “Output Frequency” dialog box. From there, repeat the
above steps from step 4.
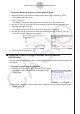
k Configuring View Window Parameters
Pressing !3(V-Window) while the graph screen is on the display displays a View
Window function key menu along the bottom of the display.