
Versão 3.10 do Software Guia do Usuário


ε-44
Graph Analysis Tool Graph Screen Operations
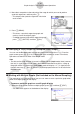
• To specify the CSV file delimiter symbol and decimal point
Press K2(MEMORY)2(CSV)2(SET) to display the CSV format setting screen. Next,
perform the procedure from step 3 under “Specifying the CSV File Delimiter Symbol and
Decimal Point” (page 3-20).
k Using Fourier Series Expansion to Transform a Waveform to a Function
Fourier series expansion is effective for studying sounds by expressing them as functions.
The procedure below assumes that there is a graph of sampled sound data already on the
graph screen.
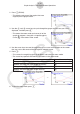
• To perform Fourier series expansion
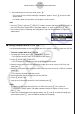
1. On the graph screen, press K, and then 4(CALC).
• The CALC menu appears at the bottom of the
display.
2. Press 1(FOURIE).
• This displays the trace pointer for selecting the graph range.
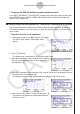
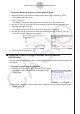
3. Move the trace pointer to the start point of the range for
which you want to perform Fourier series expansion,
and then press w.
4. Move the trace pointer to the end point of the range for which you want to perform Fourier
series expansion, and then press w.
• This displays a dialog box for specifying the start degree of the Fourier series.
→
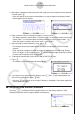
5. Input a value in the range of 1 to 99, and then press w.
• This displays a dialog box for inputting the degree of
the Fourier series.