
Versão 3.00 do Software Guia do Usuário


ε-6
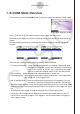
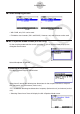
Sampling Screen
After selecting “y=f(x)”, perform the steps below.
From the EA-200, output the sound of the waveform indicated by the function input on the
calculator, and draw a graph of the function on the calculator unit screen.
1. Use the data communication cable (SB-62) to connect the communication port of the
calculator with the MASTER port of the EA-200.
2. On the above dialog box, select “y=f(x)”.
This displays a dialog box like the one shown below.
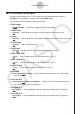
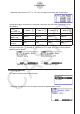
3. Press w to display the View Window screen.
The following settings will be configured automatically Ymin = −1.5, Ymax = 1.5. Do not
change these settings.
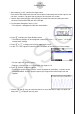
4. Press w or J to display the function registration screen.
5. In the “Y1=” line, register the function of the waveform of the sound you want to output.
For the angle unit, specify radians.
Register a function with an Y-value within the range of ±1.5.
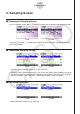
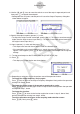
6. Press 6(DRAW) to draw the graph.
Drawing the graph causes a vertical cursor to appear on the display, as shown on the
screenshot below. Use this graph to specify the range of the sound output from the
speaker.
7. Use the d and e keys to move the vertical cursor of the output range start point and
then press w to register the start point.
•
•
•
•
•
•