
User Manual
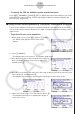
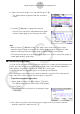
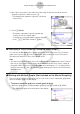
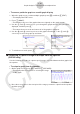
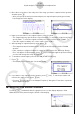

Table Of Contents
- 目录
- 介绍 — 请首先阅读这一部分!
- 第1章 基本操作
- 第2章 手动计算
- 第3章 列表功能
- 第4章 方程计算
- 第5章 绘图
- 第6章 统计图形与计算
- 第7章 财务计算
- 第8章 编程
- 第9章 数据表格
- 第10章 eActivity
- 第11章 存储器管理器
- 第12章 系统管理器
- 第13章 数据通信
- 第14章 几何
- 第15章 教学探索
- 第16章 3D图形函数
- 第17 章 Python(仅限fx-CG50)
- 第18章 分布(仅限fx-CG50)
- 附录
- 考试模式
- E-CON4 Application (English)
- 1. E-CON4 Mode Overview
- 2. Sampling Screen
- 3. Auto Sensor Detection (CLAB Only)
- 4. Selecting a Sensor
- 5. Configuring the Sampling Setup
- 6. Performing Auto Sensor Calibration and Zero Adjustment
- 7. Using a Custom Probe
- 8. Using Setup Memory
- 9. Starting a Sampling Operation
- 10. Using Sample Data Memory
- 11. Using the Graph Analysis Tools to Graph Data
- 12. Graph Analysis Tool Graph Screen Operations
- 13. Calling E-CON4 Functions from an eActivity

ε-49
Graph Analysis Tool Graph Screen Operations
3. Move the trace pointer to the end point of the range you want to output from the speaker,
and then press w.
• After you specify the start point and end point, an output frequency dialog box shown
below appears on the display.
→
4. Input a percent value for the output frequency value you want.
• The output frequency specification is a percent value. To output the original sound as-is,
specify 100%. To raise the original sound by one octave, input a value of 200%. To
lower the original sound by one octave, input a value of 50%.
5. After inputting an output frequency value, press w.
• This outputs the waveform between the start point and end point from the EA-200
speaker.
• If the sound you configured cannot be output for some reason, the message “Range
Error” will appear. If this happens, press J to scroll back through the previous setting
screens and change the setup as required.
6. To terminate sound output, press the EA-200 [START/STOP] key.
7. Press w.
• This displays a screen like the one shown nearby.
8. If you want to retry output from the speaker, press 1(Yes). To exit the procedure and
return to the graph screen, press 6(No).
• Pressing 1(Yes) returns to the “Output Frequency” dialog box. From there, repeat the
above steps from step 4.
k Configuring View Window Parameters
Pressing !3(V-Window) while the graph screen is on the display displays a View
Window function key menu along the bottom of the display.