
User Manual
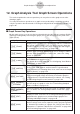
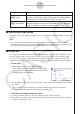
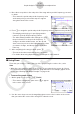
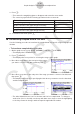
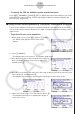
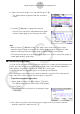
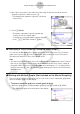
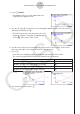
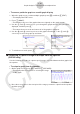
Table Of Contents
- 目录
- 介绍 — 请首先阅读这一部分!
- 第1章 基本操作
- 第2章 手动计算
- 第3章 列表功能
- 第4章 方程计算
- 第5章 绘图
- 第6章 统计图形与计算
- 第7章 财务计算
- 第8章 编程
- 第9章 数据表格
- 第10章 eActivity
- 第11章 存储器管理器
- 第12章 系统管理器
- 第13章 数据通信
- 第14章 几何
- 第15章 教学探索
- 第16章 3D图形函数
- 第17 章 Python(仅限fx-CG50)
- 第18章 分布(仅限fx-CG50)
- 附录
- 考试模式
- E-CON4 Application (English)
- 1. E-CON4 Mode Overview
- 2. Sampling Screen
- 3. Auto Sensor Detection (CLAB Only)
- 4. Selecting a Sensor
- 5. Configuring the Sampling Setup
- 6. Performing Auto Sensor Calibration and Zero Adjustment
- 7. Using a Custom Probe
- 8. Using Setup Memory
- 9. Starting a Sampling Operation
- 10. Using Sample Data Memory
- 11. Using the Graph Analysis Tools to Graph Data
- 12. Graph Analysis Tool Graph Screen Operations
- 13. Calling E-CON4 Functions from an eActivity

ε-41
Graph Analysis Tool Graph Screen Operations
3. Move the trace pointer to the end point of the range whose periodic frequency you want
to obtain.
• This causes the period and periodic frequency value
at the start point you selected in step 2 to appear
along the bottom of the screen.
4. Press w to assign the period and periodic frequency values to Alpha memory variables.
• This displays a dialog box for specifying variable
names for [Period] and [Frequency] values.
• The initial default variable name settings are “S” for
the period and “H” for the periodic frequency. To
change to another variable name, use the up and
down cursor keys to move the highlighting to the item
you want to change, and then press the applicable
letter key.
5. After everything is the way you want, press w.
• This stores the values and exits the trace operation.
• For details about using Alpha memory, see Chapter 2 of this manual.
k Using Zoom
Zoom lets you enlarge or reduce the size of the graph along the x-axis or the y-axis.
Note
• When there are multiple graphs on the screen, the procedure below zooms all of them.
For information about zooming a particular graph when there are multiple graphs on the
screen, see “Working with Multiple Graphs” on page
ε-46.
• To zoom the graph screen
1. On the graph screen, press !2(ZOOM).
• This causes a magnifying glass cursor (
) to appear
in the center of the screen.
2. Use the cursor keys to move the magnifying glass cursor to the location on the screen
that you want at the center of the enlarged or reduced screen.