
User Manual
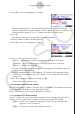
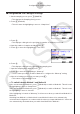
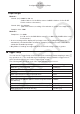
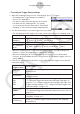
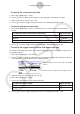
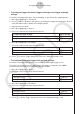
Table Of Contents
- 目录
- 介绍 — 请首先阅读这一部分!
- 第1章 基本操作
- 第2章 手动计算
- 第3章 列表功能
- 第4章 方程计算
- 第5章 绘图
- 第6章 统计图形与计算
- 第7章 财务计算
- 第8章 编程
- 第9章 数据表格
- 第10章 eActivity
- 第11章 存储器管理器
- 第12章 系统管理器
- 第13章 数据通信
- 第14章 几何
- 第15章 教学探索
- 第16章 3D图形函数
- 第17 章 Python(仅限fx-CG50)
- 第18章 分布(仅限fx-CG50)
- 附录
- 考试模式
- E-CON4 Application (English)
- 1. E-CON4 Mode Overview
- 2. Sampling Screen
- 3. Auto Sensor Detection (CLAB Only)
- 4. Selecting a Sensor
- 5. Configuring the Sampling Setup
- 6. Performing Auto Sensor Calibration and Zero Adjustment
- 7. Using a Custom Probe
- 8. Using Setup Memory
- 9. Starting a Sampling Operation
- 10. Using Sample Data Memory
- 11. Using the Graph Analysis Tools to Graph Data
- 12. Graph Analysis Tool Graph Screen Operations
- 13. Calling E-CON4 Functions from an eActivity

ε-13
Configuring the Sampling Setup
5. Press c to move the highlighting to “Samples”.
• When the sampling mode is “Periodic Sampling” and a CMA or Vernier Photogate
Pulley is assigned to the channel, “Distance” will be displayed in place of “Samples”. For
information about “Distance”, see “To configure the Distance setting” below.
6. Press e.
• This displays a dialog box for specifying the number of samples.
7. Input the number of samples and then press w.
8. Press c to move the highlighting to “Warm-up”.
9. Press one of the functions keys below.
1(Auto) … Automatically configures warm-up time settings for each sensor.
2(Manual) … Select for manual input of the warm-up time in seconds units.
3(None) … Disables warm-up time.
• Pressing 2(Manual) displays a dialog box for specifying the warm-up time. Input the
warm-up time and then press w.
• When the sampling mode is “Fast Sampling”, “FFT Graph” will be displayed in place
of “Warm-up”. For information about “FFT Graph”, see “To configure the FFT Graph
setting” below.
10. After all of settings are the way you want, press J.
• This returns to the sampling screen.
u To configure the Distance setting
Move the highlighting to “Distance” and then press 1(NUMBER). This displays a dialog box
for specifying the drop distance for the smart pulley weight.
Input a value from 0.1 to 4.0 to specify the distance in meters.
u To configure FFT Graph setting
In place of step 9 of the procedure under “Using Method 1 to Configure Settings”, specify
whether or not you want to draw a frequency characteristics graph (FFT Graph).
1(On) ... Draws an FFT graph after sampling is finished. Use the dialog box that
appears to select a frequency.
2(Off) ... FFT Graph no drawn after sampling is finished.