
User Manual
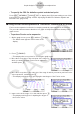
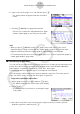
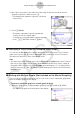
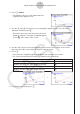
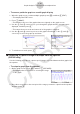
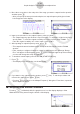
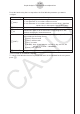


Table Of Contents
- Sisältö
- Tutustuminen — Aloita tästä!
- Luku 1 Perustoiminta
- Luku 2 Manuaaliset laskutoimitukset
- 1. Peruslaskutoimitukset
- 2. Erikoisfunktiot
- 3. Kulmatilan ja näyttömuodon määrittäminen
- 4. Funktiolaskutoimitukset
- 5. Numeeriset laskutoimitukset
- 6. Kompleksilukulaskutoimitukset
- 7. Kokonaislukujen binääri-, oktaali-, desimaali- ja heksadesimaalilaskutoimitukset
- 8. Matriisilaskutoimitukset
- 9. Vektorilaskutoimitukset
- 10. Yksikkömuunnoslaskutoimitukset
- Luku 3 Listatoiminto
- Luku 4 Yhtälölaskutoimitukset
- Luku 5 Kuvaajat
- 1. Kuvaajaesimerkkejä
- 2. Kuvaajanäytön näkymän määrittäminen
- 3. Kuvaajan piirtäminen
- 4. Kuvaajanäytön sisällön tallentaminen ja palauttaminen
- 5. Kahden kuvaajan piirtäminen samaan näyttöön
- 6. Kuvaajien piirtäminen manuaalisesti
- 7. Taulukoiden käyttäminen
- 8. Kuvaajan muokkaaminen
- 9. Kuvaajien dynaaminen piirtäminen
- 10. Rekursiokaavan kuvaajien piirtäminen
- 11. Kartioleikkausten piirtäminen
- 12. Pisteiden, viivojen ja tekstin piirtäminen kuvaajanäyttöön (Sketch)
- 13. Funktioanalyysi
- Luku 6 Tilastolliset kuvaajat ja laskutoimitukset
- 1. Ennen tilastollisten laskutoimitusten suorittamista
- 2. Yhden muuttujan tilastotietojen laskeminen ja niiden kuvaajat
- 3. Kahden muuttujan tilastotietojen laskeminen ja niiden kuvaajat (käyrän sovitus)
- 4. Tilastolaskutoimitusten suorittaminen
- 5. Testit
- 6. Luottamusväli
- 7. Jakauma
- 8. Testien syöte- ja tulostermit, luottamusväli ja jakauma
- 9. Tilastolliset kaavat
- Luku 7 Talouslaskutoimitukset
- Luku 8 Ohjelmointi
- Luku 9 Taulukkolaskenta
- Luku 10 eActivity
- Luku 11 Muistinhallinta
- Luku 12 Järjestelmänhallinta
- Luku 13 Tietoliikenne
- Luku 14 Geometria
- Luku 15 Picture Plot -toiminto
- Luku 16 3D-kuvaajatoiminto
- Luku 17 Python (vain fx-CG50, fx-CG50 AU)
- Luku 18 Jakauma (vain fx-CG50, fx-CG50 AU)
- Liite
- Koemoodit
- E-CON4 Application (English)
- 1. E-CON4 Mode Overview
- 2. Sampling Screen
- 3. Auto Sensor Detection (CLAB Only)
- 4. Selecting a Sensor
- 5. Configuring the Sampling Setup
- 6. Performing Auto Sensor Calibration and Zero Adjustment
- 7. Using a Custom Probe
- 8. Using Setup Memory
- 9. Starting a Sampling Operation
- 10. Using Sample Data Memory
- 11. Using the Graph Analysis Tools to Graph Data
- 12. Graph Analysis Tool Graph Screen Operations
- 13. Calling E-CON4 Functions from an eActivity
ε-47
Graph Analysis Tool Graph Screen Operations
2. Press 1(ZOOM).
• This displays only one of the graphs that were
originally on the graph screen.
3. Use the f and c cursor keys to cycle through the graphs until the one you want is
displayed, and then press w.
• This enters the zoom mode and causes all of the
graphs to reappear, along with a magnifying glass
cursor (
) in the center of the screen.
4. Use the cursor keys to move the magnifying glass cursor to the location on the screen
that you want at the center of the enlarged or reduced screen.
5. Press w.
• This causes the magnifying glass to disappear and enters the zoom mode.
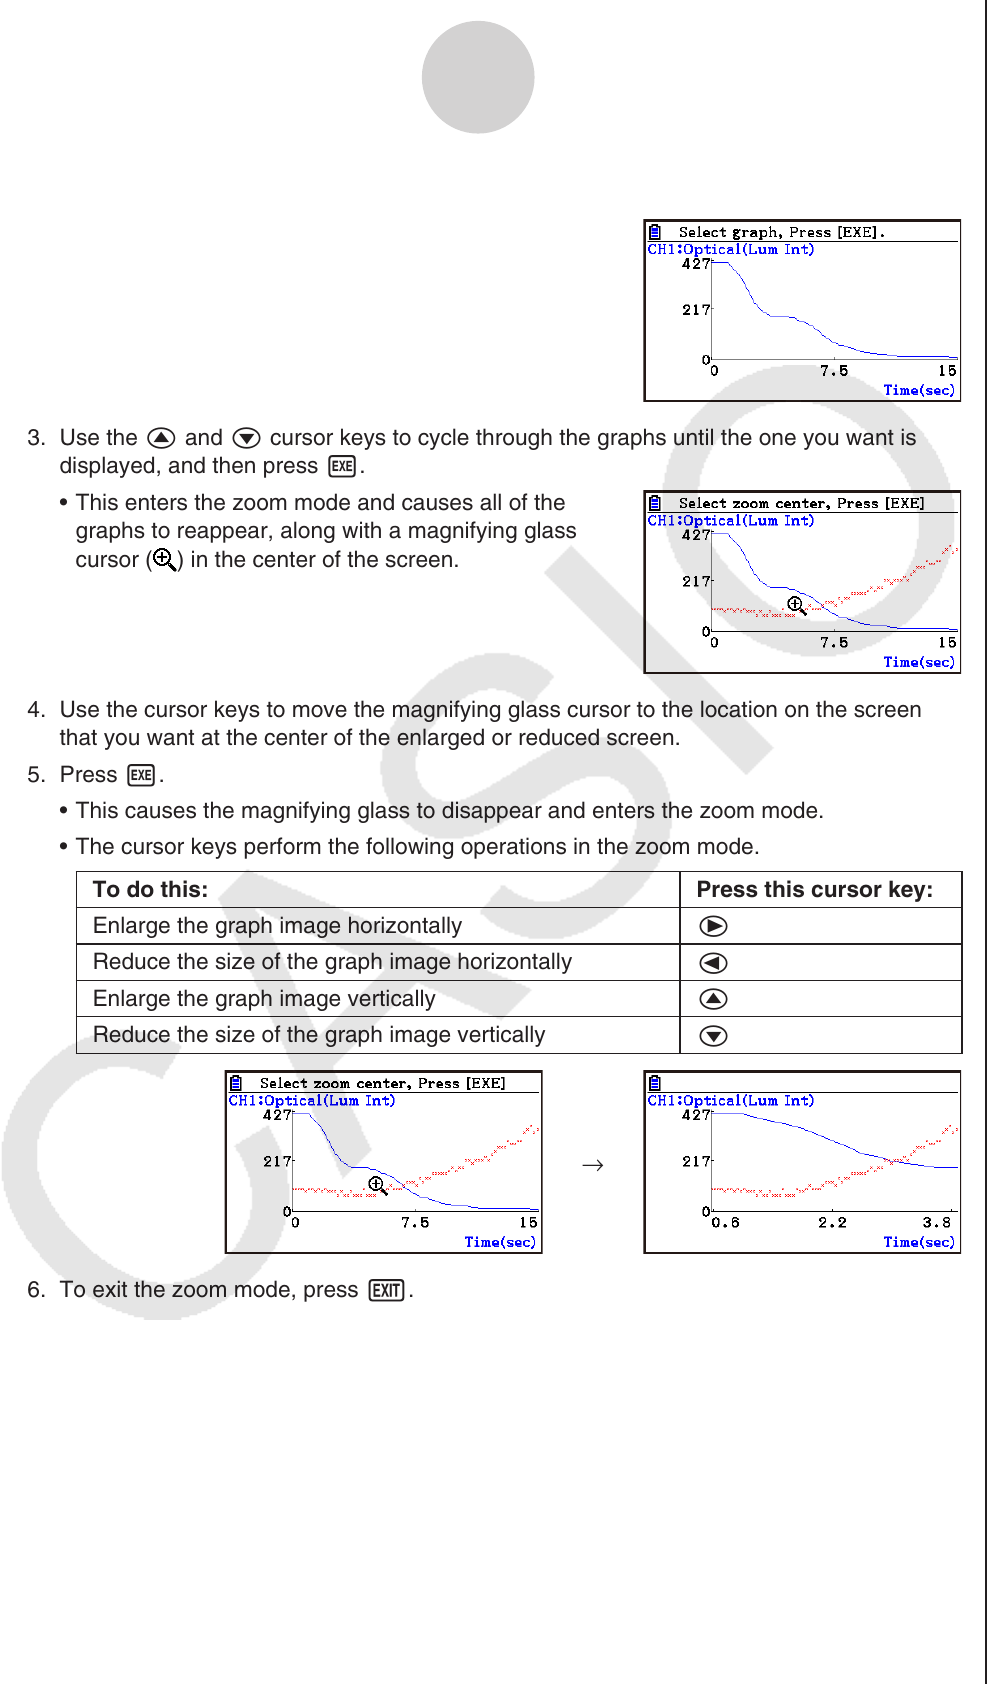
• The cursor keys perform the following operations in the zoom mode.
To do this: Press this cursor key:
Enlarge the graph image horizontally
e
Reduce the size of the graph image horizontally
d
Enlarge the graph image vertically
f
Reduce the size of the graph image vertically
c
→
6. To exit the zoom mode, press J.