
User Manual
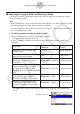

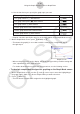


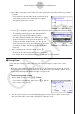
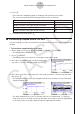
Table Of Contents
- Sisältö
- Tutustuminen — Aloita tästä!
- Luku 1 Perustoiminta
- Luku 2 Manuaaliset laskutoimitukset
- 1. Peruslaskutoimitukset
- 2. Erikoisfunktiot
- 3. Kulmatilan ja näyttömuodon määrittäminen
- 4. Funktiolaskutoimitukset
- 5. Numeeriset laskutoimitukset
- 6. Kompleksilukulaskutoimitukset
- 7. Kokonaislukujen binääri-, oktaali-, desimaali- ja heksadesimaalilaskutoimitukset
- 8. Matriisilaskutoimitukset
- 9. Vektorilaskutoimitukset
- 10. Yksikkömuunnoslaskutoimitukset
- Luku 3 Listatoiminto
- Luku 4 Yhtälölaskutoimitukset
- Luku 5 Kuvaajat
- 1. Kuvaajaesimerkkejä
- 2. Kuvaajanäytön näkymän määrittäminen
- 3. Kuvaajan piirtäminen
- 4. Kuvaajanäytön sisällön tallentaminen ja palauttaminen
- 5. Kahden kuvaajan piirtäminen samaan näyttöön
- 6. Kuvaajien piirtäminen manuaalisesti
- 7. Taulukoiden käyttäminen
- 8. Kuvaajan muokkaaminen
- 9. Kuvaajien dynaaminen piirtäminen
- 10. Rekursiokaavan kuvaajien piirtäminen
- 11. Kartioleikkausten piirtäminen
- 12. Pisteiden, viivojen ja tekstin piirtäminen kuvaajanäyttöön (Sketch)
- 13. Funktioanalyysi
- Luku 6 Tilastolliset kuvaajat ja laskutoimitukset
- 1. Ennen tilastollisten laskutoimitusten suorittamista
- 2. Yhden muuttujan tilastotietojen laskeminen ja niiden kuvaajat
- 3. Kahden muuttujan tilastotietojen laskeminen ja niiden kuvaajat (käyrän sovitus)
- 4. Tilastolaskutoimitusten suorittaminen
- 5. Testit
- 6. Luottamusväli
- 7. Jakauma
- 8. Testien syöte- ja tulostermit, luottamusväli ja jakauma
- 9. Tilastolliset kaavat
- Luku 7 Talouslaskutoimitukset
- Luku 8 Ohjelmointi
- Luku 9 Taulukkolaskenta
- Luku 10 eActivity
- Luku 11 Muistinhallinta
- Luku 12 Järjestelmänhallinta
- Luku 13 Tietoliikenne
- Luku 14 Geometria
- Luku 15 Picture Plot -toiminto
- Luku 16 3D-kuvaajatoiminto
- Luku 17 Python (vain fx-CG50, fx-CG50 AU)
- Luku 18 Jakauma (vain fx-CG50, fx-CG50 AU)
- Liite
- Koemoodit
- E-CON4 Application (English)
- 1. E-CON4 Mode Overview
- 2. Sampling Screen
- 3. Auto Sensor Detection (CLAB Only)
- 4. Selecting a Sensor
- 5. Configuring the Sampling Setup
- 6. Performing Auto Sensor Calibration and Zero Adjustment
- 7. Using a Custom Probe
- 8. Using Setup Memory
- 9. Starting a Sampling Operation
- 10. Using Sample Data Memory
- 11. Using the Graph Analysis Tools to Graph Data
- 12. Graph Analysis Tool Graph Screen Operations
- 13. Calling E-CON4 Functions from an eActivity
ε-43
Graph Analysis Tool Graph Screen Operations
5. After everything is the way you want, press w.
• This saves the lists and the message “Complete!” appears. Press w to return to the
graph screen.
• For details about using list data, see Chapter 3 of this manual.
Note
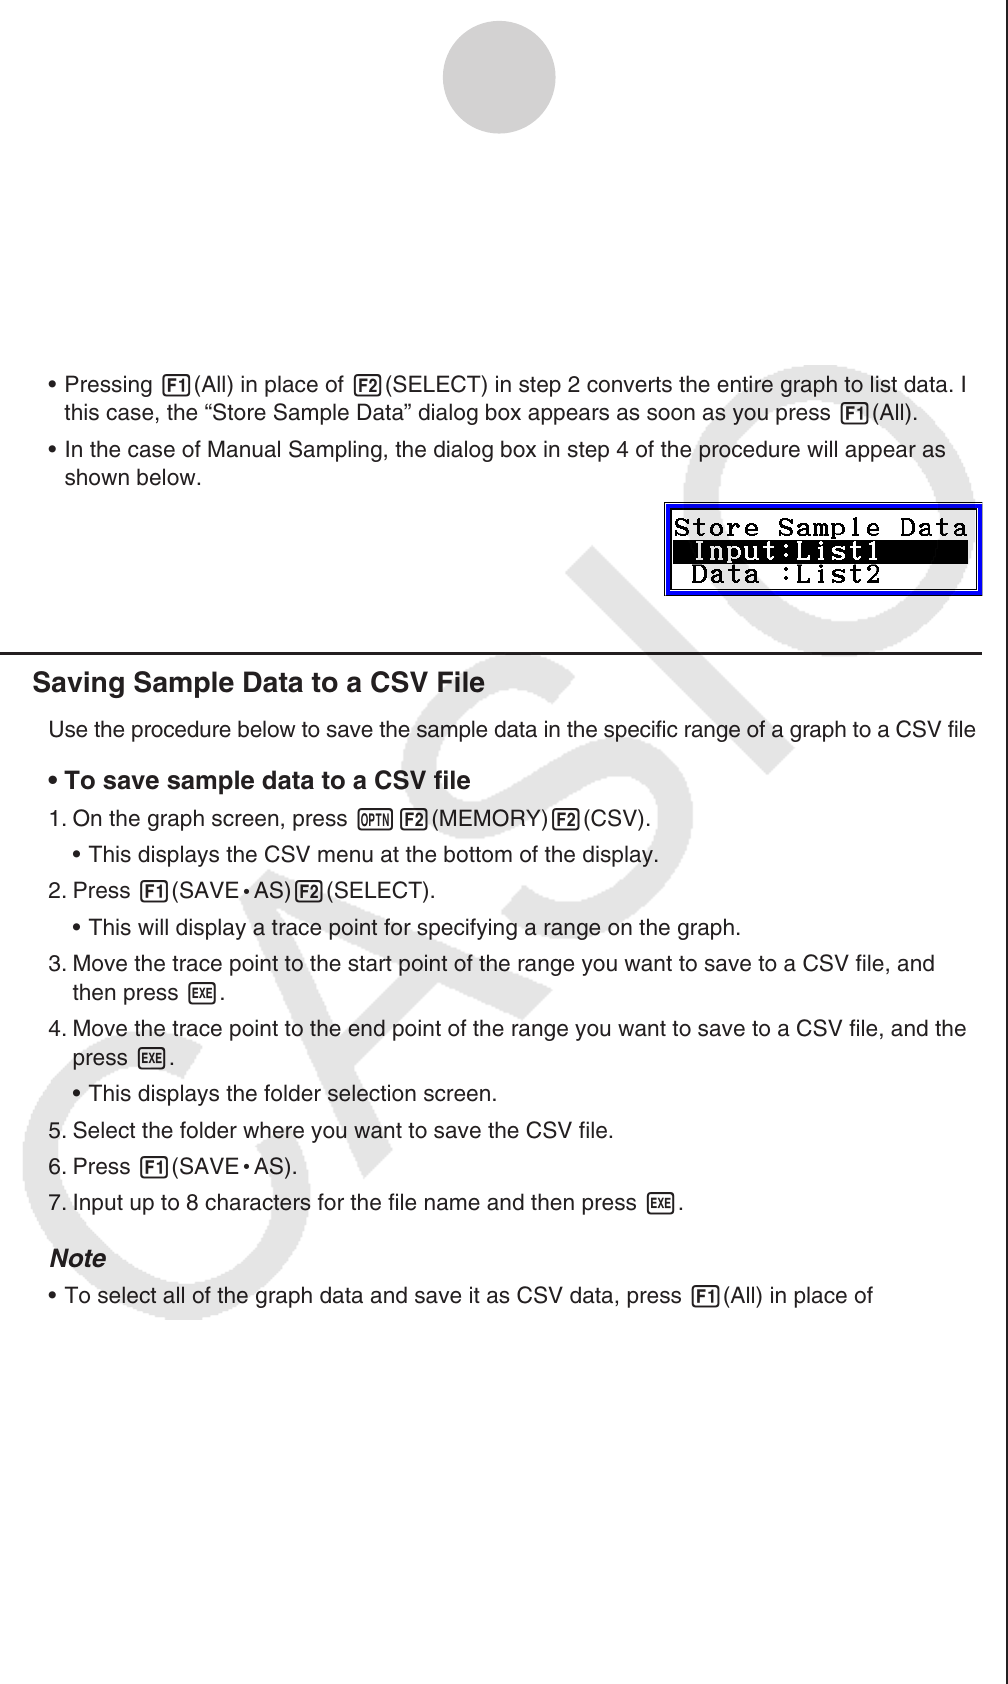
• Pressing 1(All) in place of 2(SELECT) in step 2 converts the entire graph to list data. In
this case, the “Store Sample Data” dialog box appears as soon as you press 1(All).
• In the case of Manual Sampling, the dialog box in step 4 of the procedure will appear as
shown below.
k Saving Sample Data to a CSV File
Use the procedure below to save the sample data in the specific range of a graph to a CSV file.
• To save sample data to a CSV file
1. On the graph screen, press K2(MEMORY)2(CSV).
• This displays the CSV menu at the bottom of the display.
2. Press 1(SAVE
•
AS)2(SELECT).
• This will display a trace point for specifying a range on the graph.
3. Move the trace point to the start point of the range you want to save to a CSV file, and
then press w.
4. Move the trace point to the end point of the range you want to save to a CSV file, and then
press w.
• This displays the folder selection screen.
5. Select the folder where you want to save the CSV file.
6. Press 1(SAVE
•
AS).
7. Input up to 8 characters for the file name and then press w.
Note
• To select all of the graph data and save it as CSV data, press 1(All) in place of
2(SELECT) in step 2 above. The folder selection screen will appear as soon as you
press 1(All).
• If there are multiple graphs on the graph screen, use f and c to select the graph you
want and then press w. (Not included on the Manual Sampling)