
User Manual
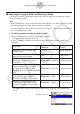

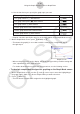


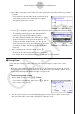
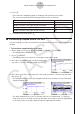
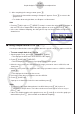
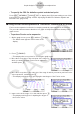
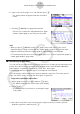
Table Of Contents
- Sisältö
- Tutustuminen — Aloita tästä!
- Luku 1 Perustoiminta
- Luku 2 Manuaaliset laskutoimitukset
- 1. Peruslaskutoimitukset
- 2. Erikoisfunktiot
- 3. Kulmatilan ja näyttömuodon määrittäminen
- 4. Funktiolaskutoimitukset
- 5. Numeeriset laskutoimitukset
- 6. Kompleksilukulaskutoimitukset
- 7. Kokonaislukujen binääri-, oktaali-, desimaali- ja heksadesimaalilaskutoimitukset
- 8. Matriisilaskutoimitukset
- 9. Vektorilaskutoimitukset
- 10. Yksikkömuunnoslaskutoimitukset
- Luku 3 Listatoiminto
- Luku 4 Yhtälölaskutoimitukset
- Luku 5 Kuvaajat
- 1. Kuvaajaesimerkkejä
- 2. Kuvaajanäytön näkymän määrittäminen
- 3. Kuvaajan piirtäminen
- 4. Kuvaajanäytön sisällön tallentaminen ja palauttaminen
- 5. Kahden kuvaajan piirtäminen samaan näyttöön
- 6. Kuvaajien piirtäminen manuaalisesti
- 7. Taulukoiden käyttäminen
- 8. Kuvaajan muokkaaminen
- 9. Kuvaajien dynaaminen piirtäminen
- 10. Rekursiokaavan kuvaajien piirtäminen
- 11. Kartioleikkausten piirtäminen
- 12. Pisteiden, viivojen ja tekstin piirtäminen kuvaajanäyttöön (Sketch)
- 13. Funktioanalyysi
- Luku 6 Tilastolliset kuvaajat ja laskutoimitukset
- 1. Ennen tilastollisten laskutoimitusten suorittamista
- 2. Yhden muuttujan tilastotietojen laskeminen ja niiden kuvaajat
- 3. Kahden muuttujan tilastotietojen laskeminen ja niiden kuvaajat (käyrän sovitus)
- 4. Tilastolaskutoimitusten suorittaminen
- 5. Testit
- 6. Luottamusväli
- 7. Jakauma
- 8. Testien syöte- ja tulostermit, luottamusväli ja jakauma
- 9. Tilastolliset kaavat
- Luku 7 Talouslaskutoimitukset
- Luku 8 Ohjelmointi
- Luku 9 Taulukkolaskenta
- Luku 10 eActivity
- Luku 11 Muistinhallinta
- Luku 12 Järjestelmänhallinta
- Luku 13 Tietoliikenne
- Luku 14 Geometria
- Luku 15 Picture Plot -toiminto
- Luku 16 3D-kuvaajatoiminto
- Luku 17 Python (vain fx-CG50, fx-CG50 AU)
- Luku 18 Jakauma (vain fx-CG50, fx-CG50 AU)
- Liite
- Koemoodit
- E-CON4 Application (English)
- 1. E-CON4 Mode Overview
- 2. Sampling Screen
- 3. Auto Sensor Detection (CLAB Only)
- 4. Selecting a Sensor
- 5. Configuring the Sampling Setup
- 6. Performing Auto Sensor Calibration and Zero Adjustment
- 7. Using a Custom Probe
- 8. Using Setup Memory
- 9. Starting a Sampling Operation
- 10. Using Sample Data Memory
- 11. Using the Graph Analysis Tools to Graph Data
- 12. Graph Analysis Tool Graph Screen Operations
- 13. Calling E-CON4 Functions from an eActivity
ε-37
Using the Graph Analysis Tools to Graph Data
3. Press 2(DATA).
• This displays the Sampling Data List screen.
4. Specify the sampled data for graphing.
a. Use the f and c cursor keys to move the highlighting to the name of the sampled
data file you want to select, and then press 1(ASSIGN) or w.
• This returns to the Graph Mode screen, which shows the name of the sample data file
you selected.
Graph on/off indicator
Sample data file name
Name of sensor used for sampling
Graph Mode Screen
b. Repeat step a above to specify sample data files for other graphs, if there are any.
• If you select “Graph Analysis” as the analysis mode in step 2, you must specify
sample data files for three graphs. If you select “Compare Graph” as the analysis
mode in step 2, you must specify sample data files for two graphs. With other modes,
you need to specify only one sample data file.
• For details about Sampling Data List screen operations, see “Using Sample Data
Memory” (page
ε-33).
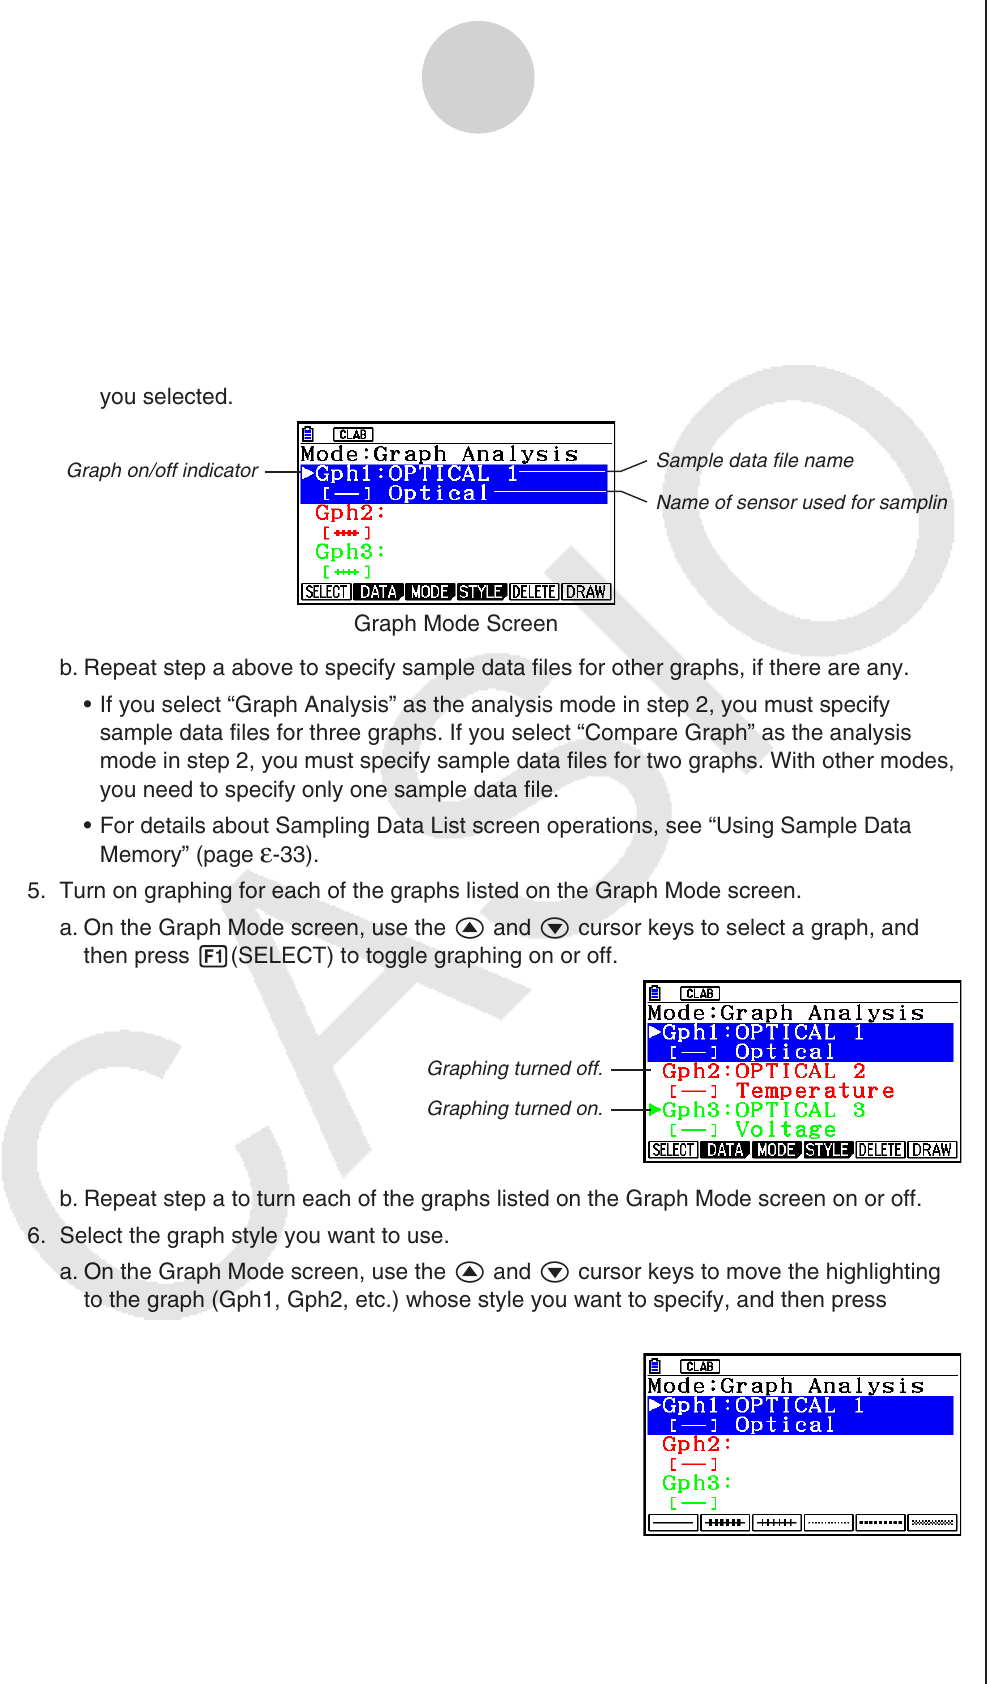
5. Turn on graphing for each of the graphs listed on the Graph Mode screen.
a. On the Graph Mode screen, use the f and c cursor keys to select a graph, and
then press 1(SELECT) to toggle graphing on or off.
Graphing turned off.
Graphing turned on.
b. Repeat step a to turn each of the graphs listed on the Graph Mode screen on or off.
6. Select the graph style you want to use.
a. On the Graph Mode screen, use the f and c cursor keys to move the highlighting
to the graph (Gph1, Gph2, etc.) whose style you want to specify, and then press
4(STYLE). This will cause the function menu to change as shown below.