
User Manual
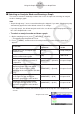
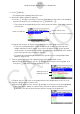
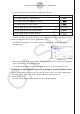
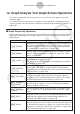
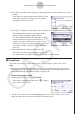
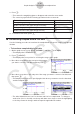
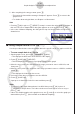
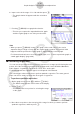
Table Of Contents
- المحتويات
- للتعرف – اقرأ هذا أوّلاً!
- الفصل الأول العمليات الأساسية
- الفصل الثاني الحسابات اليدوية
- 1. الحسابات الاساسية
- 2. الوظائف الخاصة
- 3. تحديد وحدة الزاوية و شكل العرض
- 4. وظيفة العمليات الحسابية
- 5. العمليات الحسابية العددية
- 6. العمليات الحسابية لعدد مركب
- 7. العمليات الحسابية, الثنائية,الثمانية والعشرية و الست عشرية مع أعداد صحيحة
- 8. مصفوفة العمليات الحسابية
- 9. العمليات الحسابية للمتجهات
- 10. العمليات الحسابية لتحويل المصفوفة
- الفصل الثالث وظيفة القائمة
- الفصل الرابع العمليات الحسابية للمعادلات
- الفصل الخامس الرسم البياني
- 1. الرسوم البيانية البسيطة
- 2. التحكم بما يظهر على شاشة الرسم البياني
- 3. رسم الرسم البياني
- 4. حفظ و استدعاء محتويات شاشة الرسم البياني
- 5. رسم رسمين بيانيين على نفس الشاشة
- 6. الرسم البياني اليدوي
- 7. استخدام الجداول
- 8. تعديل الرسم البياني
- 9. رسم الرسم البياني الديناميكي
- 10. رسم صيغة الإعادة
- 11. رسم القسم المخروطي
- 12. رسم النقاط، و الخطوط، و النصوص على شاشة الرسم البياني (التخطيط)
- 13. تحليلات الوظيفة
- الفصل السادس الرسم البياني الإحصائي والعمليات الحسابية
- 1. قبل ان تقوم باداء العمليات الحسابية الإحصائية
- 2. القيام بعملية حسابية ورسماً بيانيا للبيانات الإحصائية لمتغير-واحد
- 3. القيام بعملية حسابية و رسم بياني للبيانات الإحصائية لمتغير - مزدوج (توفيق المنحنيات)
- 4. إجراء عمليات حسابية إحصائية
- 5. الاختبار
- 6. فاصل الثقة
- 7. توزيع
- 8. مصطلحات مدخلات ومخرجات الاختبار، فاصل الثقة والتوزيع
- 9. الصيغة الاحصائية
- الفصل السابع العملية الحسابية المالية
- الفصل الثامن البرمجة
- الفصل التاسع الجدول
- الفصل العاشر eActivity
- الفصل الحادي عشر مدير الذاكرة
- الفصل الثاني عشر مدير النظام
- لفصل الثالث عشر ربط البيانات
- الفصل الرابع عشر الهندسة
- الفصل الخامس عشر مخطط الصورة
- الفصل السادس عشر وظيفة وضع الرسم البياني ثلاثي الأبعاد 3D
- الفصل السابع عشر Python (لـ fx-CG50، وfx-CG50 AU فقط)
- الفصل الثامن عشر التوزيع (لـ fx-CG50، وfx-CG50 AU فقط)
- ملحق
- أوضاع الاختبار
- E-CON4 Application (English)
- 1. E-CON4 Mode Overview
- 2. Sampling Screen
- 3. Auto Sensor Detection (CLAB Only)
- 4. Selecting a Sensor
- 5. Configuring the Sampling Setup
- 6. Performing Auto Sensor Calibration and Zero Adjustment
- 7. Using a Custom Probe
- 8. Using Setup Memory
- 9. Starting a Sampling Operation
- 10. Using Sample Data Memory
- 11. Using the Graph Analysis Tools to Graph Data
- 12. Graph Analysis Tool Graph Screen Operations
- 13. Calling E-CON4 Functions from an eActivity

ε-43
Graph Analysis Tool Graph Screen Operations
5. After everything is the way you want, press w.
• This saves the lists and the message “Complete!” appears. Press w to return to the
graph screen.
• For details about using list data, see Chapter 3 of this manual.
Note
• Pressing 1(All) in place of 2(SELECT) in step 2 converts the entire graph to list data. In
this case, the “Store Sample Data” dialog box appears as soon as you press 1(All).
• In the case of Manual Sampling, the dialog box in step 4 of the procedure will appear as
shown below.
k Saving Sample Data to a CSV File
Use the procedure below to save the sample data in the specific range of a graph to a CSV file.
• To save sample data to a CSV file
1. On the graph screen, press K2(MEMORY)2(CSV).
• This displays the CSV menu at the bottom of the display.
2. Press 1(SAVE
•
AS)2(SELECT).
• This will display a trace point for specifying a range on the graph.
3. Move the trace point to the start point of the range you want to save to a CSV file, and
then press w.
4. Move the trace point to the end point of the range you want to save to a CSV file, and then
press w.
• This displays the folder selection screen.
5. Select the folder where you want to save the CSV file.
6. Press 1(SAVE
•
AS).
7. Input up to 8 characters for the file name and then press w.
Note
• To select all of the graph data and save it as CSV data, press 1(All) in place of
2(SELECT) in step 2 above. The folder selection screen will appear as soon as you
press 1(All).
• If there are multiple graphs on the graph screen, use f and c to select the graph you
want and then press w. (Not included on the Manual Sampling)