
User Manual


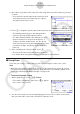
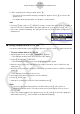
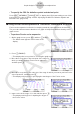
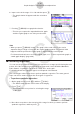
Table Of Contents
- Innehåll
- Komma igång — Läs det här först!
- Kapitel 1 Grundläggande funktioner
- Kapitel 2 Manuella beräkningar
- 1. Grundläggande beräkningar
- 2. Specialfunktioner
- 3. Ange vinkelenhet och visningsformat
- 4. Funktionsberäkningar
- 5. Numeriska beräkningar
- 6. Beräkningar med komplexa tal
- 7. Beräkningar med binär, oktal, decimal och hexadecimal heltalsaritmetik
- 8. Matrisberäkningar
- 9. Vektorberäkningar
- 10. Beräkning av meterkonvertering
- Kapitel 3 Listfunktionen
- Kapitel 4 Ekvationer
- Kapitel 5 Grafritning
- 1. Exempelgrafer
- 2. Kontrollera vad som visas på en grafskärm
- 3. Rita en graf
- 4. Spara och hämta grafskärminnehåll
- 5. Rita två grafer på samma skärm
- 6. Manuella grafer
- 7. Använda tabeller
- 8. Modifiera en graf
- 9. Dynamiska grafer
- 10. Grafer och rekursionsformler
- 11. Rita en graf över ett kägelsnitt
- 12. Rita punkter, linjer och text på grafskärmen (Sketch)
- 13. Funktionsanalys
- Kapitel 6 Statistikgrafer och beräkningar
- 1. Innan du utför statistikberäkningar
- 2. Beräkna och rita graf för statistiska data för en variabel
- 3. Beräkna och rita statistisk data för variabelpar (kurvpassning)
- 4. Utföra statstikberäkningar
- 5. Tester
- 6. Konfidensintervall
- 7. Fördelning
- 8. Inmatnings- och utmatningstermer för test, konfidensintervall och fördelning
- 9. Statistikformel
- Kapitel 7 Ekonomiska beräkningar
- Kapitel 8 Programmering
- 1. Grundläggande programmering
- 2. Funktionstangenter i läget Program
- 3. Redigera programinnehåll
- 4. Filhantering
- 5. Kommandoreferens
- 6. Använda räknarfunktioner i program
- 7. Kommandon i läget Program
- 8. Särskilda kommandon för CASIO-räknare för funktionsvärden <=> textkonverteringstabell
- 9. Programbibliotek
- Kapitel 9 Kalkylblad
- Kapitel 10 eActivity
- Kapitel 11 Minneshanterare
- Kapitel 12 Systemhanterare
- Kapitel 13 Datakommunikation
- Kapitel 14 Geometri
- Kapitel 15 Picture Plot
- Kapitel 16 3D-graffunktion
- Kapitel 17 Python (endast fx-CG50, fx-CG50 AU)
- Kapitel 18 Fördelning (endast fx-CG50, fx-CG50 AU)
- Funktionstangenter i läget Bilaga
- Examinationslägen
- E-CON4 Application (English)
- 1. E-CON4 Mode Overview
- 2. Sampling Screen
- 3. Auto Sensor Detection (CLAB Only)
- 4. Selecting a Sensor
- 5. Configuring the Sampling Setup
- 6. Performing Auto Sensor Calibration and Zero Adjustment
- 7. Using a Custom Probe
- 8. Using Setup Memory
- 9. Starting a Sampling Operation
- 10. Using Sample Data Memory
- 11. Using the Graph Analysis Tools to Graph Data
- 12. Graph Analysis Tool Graph Screen Operations
- 13. Calling E-CON4 Functions from an eActivity

ε-43
Graph Analysis Tool Graph Screen Operations
5. After everything is the way you want, press w.
• This saves the lists and the message “Complete!” appears. Press w to return to the
graph screen.
• For details about using list data, see Chapter 3 of this manual.
Note
• Pressing 1(All) in place of 2(SELECT) in step 2 converts the entire graph to list data. In
this case, the “Store Sample Data” dialog box appears as soon as you press 1(All).
• In the case of Manual Sampling, the dialog box in step 4 of the procedure will appear as
shown below.
k Saving Sample Data to a CSV File
Use the procedure below to save the sample data in the specific range of a graph to a CSV file.
• To save sample data to a CSV file
1. On the graph screen, press K2(MEMORY)2(CSV).
• This displays the CSV menu at the bottom of the display.
2. Press 1(SAVE
•
AS)2(SELECT).
• This will display a trace point for specifying a range on the graph.
3. Move the trace point to the start point of the range you want to save to a CSV file, and
then press w.
4. Move the trace point to the end point of the range you want to save to a CSV file, and then
press w.
• This displays the folder selection screen.
5. Select the folder where you want to save the CSV file.
6. Press 1(SAVE
•
AS).
7. Input up to 8 characters for the file name and then press w.
Note
• To select all of the graph data and save it as CSV data, press 1(All) in place of
2(SELECT) in step 2 above. The folder selection screen will appear as soon as you
press 1(All).
• If there are multiple graphs on the graph screen, use f and c to select the graph you
want and then press w. (Not included on the Manual Sampling)