
User Manual


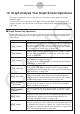
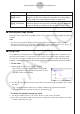
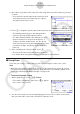
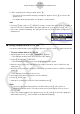
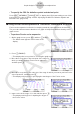
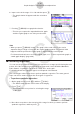
Table Of Contents
- Innehåll
- Komma igång — Läs det här först!
- Kapitel 1 Grundläggande funktioner
- Kapitel 2 Manuella beräkningar
- 1. Grundläggande beräkningar
- 2. Specialfunktioner
- 3. Ange vinkelenhet och visningsformat
- 4. Funktionsberäkningar
- 5. Numeriska beräkningar
- 6. Beräkningar med komplexa tal
- 7. Beräkningar med binär, oktal, decimal och hexadecimal heltalsaritmetik
- 8. Matrisberäkningar
- 9. Vektorberäkningar
- 10. Beräkning av meterkonvertering
- Kapitel 3 Listfunktionen
- Kapitel 4 Ekvationer
- Kapitel 5 Grafritning
- 1. Exempelgrafer
- 2. Kontrollera vad som visas på en grafskärm
- 3. Rita en graf
- 4. Spara och hämta grafskärminnehåll
- 5. Rita två grafer på samma skärm
- 6. Manuella grafer
- 7. Använda tabeller
- 8. Modifiera en graf
- 9. Dynamiska grafer
- 10. Grafer och rekursionsformler
- 11. Rita en graf över ett kägelsnitt
- 12. Rita punkter, linjer och text på grafskärmen (Sketch)
- 13. Funktionsanalys
- Kapitel 6 Statistikgrafer och beräkningar
- 1. Innan du utför statistikberäkningar
- 2. Beräkna och rita graf för statistiska data för en variabel
- 3. Beräkna och rita statistisk data för variabelpar (kurvpassning)
- 4. Utföra statstikberäkningar
- 5. Tester
- 6. Konfidensintervall
- 7. Fördelning
- 8. Inmatnings- och utmatningstermer för test, konfidensintervall och fördelning
- 9. Statistikformel
- Kapitel 7 Ekonomiska beräkningar
- Kapitel 8 Programmering
- 1. Grundläggande programmering
- 2. Funktionstangenter i läget Program
- 3. Redigera programinnehåll
- 4. Filhantering
- 5. Kommandoreferens
- 6. Använda räknarfunktioner i program
- 7. Kommandon i läget Program
- 8. Särskilda kommandon för CASIO-räknare för funktionsvärden <=> textkonverteringstabell
- 9. Programbibliotek
- Kapitel 9 Kalkylblad
- Kapitel 10 eActivity
- Kapitel 11 Minneshanterare
- Kapitel 12 Systemhanterare
- Kapitel 13 Datakommunikation
- Kapitel 14 Geometri
- Kapitel 15 Picture Plot
- Kapitel 16 3D-graffunktion
- Kapitel 17 Python (endast fx-CG50, fx-CG50 AU)
- Kapitel 18 Fördelning (endast fx-CG50, fx-CG50 AU)
- Funktionstangenter i läget Bilaga
- Examinationslägen
- E-CON4 Application (English)
- 1. E-CON4 Mode Overview
- 2. Sampling Screen
- 3. Auto Sensor Detection (CLAB Only)
- 4. Selecting a Sensor
- 5. Configuring the Sampling Setup
- 6. Performing Auto Sensor Calibration and Zero Adjustment
- 7. Using a Custom Probe
- 8. Using Setup Memory
- 9. Starting a Sampling Operation
- 10. Using Sample Data Memory
- 11. Using the Graph Analysis Tools to Graph Data
- 12. Graph Analysis Tool Graph Screen Operations
- 13. Calling E-CON4 Functions from an eActivity

ε-40
Graph Analysis Tool Graph Screen Operations
Key Operation Description
K5(Y=fx)
Displays the graph relation list, which lets you select a Y=f(x)
graph to overlay on the sampled result graph. See “Overlaying a
Y=f(x) Graph on a Sampled Result Graph” on page
ε-46.
K6(SPEAKER)
Starts an operation for outputting a specific range of a sound data
waveform graph from the speaker (EA-200 only). See “Outputting
a Specific Range of a Graph from the Speaker” on page
ε-48.
k Scrolling the Graph Screen
Press the cursor keys while the graph screen is on the display scrolls the graph left, right, up,
or down.
Note
• The cursor keys perform different operations besides scrolling while a trace or graph
operation is in progress. To perform a graph screen scroll operation in this case, press J
to cancel the trace or graph operation, and then press the cursor keys.
k Using Trace
Trace displays a crosshair pointer on the displayed graph along with the coordinates of the
current cursor position. You can use the cursor keys to move the pointer along the graph.
You can also use trace to obtain the periodic frequency value for a particular range, and
assign the range (time) and periodic frequency values in separate Alpha memory variables.
• To use trace
1. On the graph screen, press !1(TRACE).
• This causes a trace pointer to appear on the graph.
The coordinates of the current trace pointer location
are also shown on the display.
2. Use the d and e cursor keys to move the trace pointer along the graph to the location
you want.
• The coordinate values change in accordance with the trace pointer movement.
• You can exit the trace pointer at any time by pressing J.
• To obtain the periodic frequency value
1. Use the procedure under “To use trace” above to start a trace operation.
2. Move the trace pointer to the start point of the range whose periodic frequency you want
to obtain, and then press w.