
User Manual
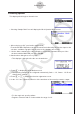

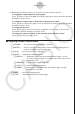
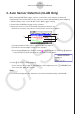
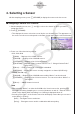

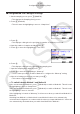
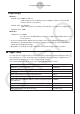
Table Of Contents
- Innehåll
- Komma igång — Läs det här först!
- Kapitel 1 Grundläggande funktioner
- Kapitel 2 Manuella beräkningar
- 1. Grundläggande beräkningar
- 2. Specialfunktioner
- 3. Ange vinkelenhet och visningsformat
- 4. Funktionsberäkningar
- 5. Numeriska beräkningar
- 6. Beräkningar med komplexa tal
- 7. Beräkningar med binär, oktal, decimal och hexadecimal heltalsaritmetik
- 8. Matrisberäkningar
- 9. Vektorberäkningar
- 10. Beräkning av meterkonvertering
- Kapitel 3 Listfunktionen
- Kapitel 4 Ekvationer
- Kapitel 5 Grafritning
- 1. Exempelgrafer
- 2. Kontrollera vad som visas på en grafskärm
- 3. Rita en graf
- 4. Spara och hämta grafskärminnehåll
- 5. Rita två grafer på samma skärm
- 6. Manuella grafer
- 7. Använda tabeller
- 8. Modifiera en graf
- 9. Dynamiska grafer
- 10. Grafer och rekursionsformler
- 11. Rita en graf över ett kägelsnitt
- 12. Rita punkter, linjer och text på grafskärmen (Sketch)
- 13. Funktionsanalys
- Kapitel 6 Statistikgrafer och beräkningar
- 1. Innan du utför statistikberäkningar
- 2. Beräkna och rita graf för statistiska data för en variabel
- 3. Beräkna och rita statistisk data för variabelpar (kurvpassning)
- 4. Utföra statstikberäkningar
- 5. Tester
- 6. Konfidensintervall
- 7. Fördelning
- 8. Inmatnings- och utmatningstermer för test, konfidensintervall och fördelning
- 9. Statistikformel
- Kapitel 7 Ekonomiska beräkningar
- Kapitel 8 Programmering
- 1. Grundläggande programmering
- 2. Funktionstangenter i läget Program
- 3. Redigera programinnehåll
- 4. Filhantering
- 5. Kommandoreferens
- 6. Använda räknarfunktioner i program
- 7. Kommandon i läget Program
- 8. Särskilda kommandon för CASIO-räknare för funktionsvärden <=> textkonverteringstabell
- 9. Programbibliotek
- Kapitel 9 Kalkylblad
- Kapitel 10 eActivity
- Kapitel 11 Minneshanterare
- Kapitel 12 Systemhanterare
- Kapitel 13 Datakommunikation
- Kapitel 14 Geometri
- Kapitel 15 Picture Plot
- Kapitel 16 3D-graffunktion
- Kapitel 17 Python (endast fx-CG50, fx-CG50 AU)
- Kapitel 18 Fördelning (endast fx-CG50, fx-CG50 AU)
- Funktionstangenter i läget Bilaga
- Examinationslägen
- E-CON4 Application (English)
- 1. E-CON4 Mode Overview
- 2. Sampling Screen
- 3. Auto Sensor Detection (CLAB Only)
- 4. Selecting a Sensor
- 5. Configuring the Sampling Setup
- 6. Performing Auto Sensor Calibration and Zero Adjustment
- 7. Using a Custom Probe
- 8. Using Setup Memory
- 9. Starting a Sampling Operation
- 10. Using Sample Data Memory
- 11. Using the Graph Analysis Tools to Graph Data
- 12. Graph Analysis Tool Graph Screen Operations
- 13. Calling E-CON4 Functions from an eActivity

ε-13
Configuring the Sampling Setup
5. Press c to move the highlighting to “Samples”.
• When the sampling mode is “Periodic Sampling” and a CMA or Vernier Photogate
Pulley is assigned to the channel, “Distance” will be displayed in place of “Samples”. For
information about “Distance”, see “To configure the Distance setting” below.
6. Press e.
• This displays a dialog box for specifying the number of samples.
7. Input the number of samples and then press w.
8. Press c to move the highlighting to “Warm-up”.
9. Press one of the functions keys below.
1(Auto) … Automatically configures warm-up time settings for each sensor.
2(Manual) … Select for manual input of the warm-up time in seconds units.
3(None) … Disables warm-up time.
• Pressing 2(Manual) displays a dialog box for specifying the warm-up time. Input the
warm-up time and then press w.
• When the sampling mode is “Fast Sampling”, “FFT Graph” will be displayed in place
of “Warm-up”. For information about “FFT Graph”, see “To configure the FFT Graph
setting” below.
10. After all of settings are the way you want, press J.
• This returns to the sampling screen.
u To configure the Distance setting
Move the highlighting to “Distance” and then press 1(NUMBER). This displays a dialog box
for specifying the drop distance for the smart pulley weight.
Input a value from 0.1 to 4.0 to specify the distance in meters.
u To configure FFT Graph setting
In place of step 9 of the procedure under “Using Method 1 to Configure Settings”, specify
whether or not you want to draw a frequency characteristics graph (FFT Graph).
1(On) ... Draws an FFT graph after sampling is finished. Use the dialog box that
appears to select a frequency.
2(Off) ... FFT Graph no drawn after sampling is finished.