
User Manual
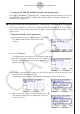
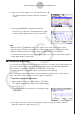
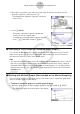

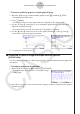
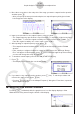
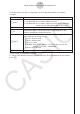

Table Of Contents
- Innhold
- Bli kjent – Les dette først!
- Kapittel 1 Grunnleggende bruk
- Kapittel 2 Manuelle beregninger
- 1. Grunnleggende beregninger
- 2. Spesialfunksjoner
- 3. Angi vinkelenhet og displayformat
- 4. Funksjonsberegninger
- 5. Numeriske beregninger
- 6. Beregninger med komplekse tall
- 7. Binære, oktale, desimale og heksadesimale heltallsberegninger
- 8. Matriseberegninger
- 9. Vektorberegninger
- 10. Metriske omformingsberegninger
- Kapittel 3 Listefunksjon
- Kapittel 4 Likningsberegninger
- Kapittel 5 Graftegning
- 1. Eksempelgrafer
- 2. Bestemme hva som skal vises på et grafskjermbilde
- 3. Tegne en graf
- 4. Lagre og hente frem innholdet av grafskjermbildet
- 5. Tegne to grafer på samme skjerm
- 6. Manuell graftegning
- 7. Bruke tabeller
- 8. Endre en graf
- 9. Dynamisk grafskriving
- 10. Tegne graf for en rekursjonsformel
- 11. Tegne kjeglesnitt som graf
- 12. Tegning av punkter, linjer og tekst på grafskjermen (Skisse)
- 13. Funksjonsanalyse
- Kapittel 6 Statistiske grafer og beregninger
- 1. Før du utfører statistiske beregninger
- 2. Beregne og tegne grafer for statistiske data med én variabel
- 3. Beregne og tegne grafer for statistiske data med parvise variabler (kurve montering)
- 4. Utføre statistiske beregninger
- 5. Tester
- 6. Konfidensintervall
- 7. Distribusjon
- 8. Inntastings- og utdataledd for tester, konfidensintervall og distribusjon
- 9. Statistisk formel
- Kapittel 7 Økonomiske beregninger
- 1. Før du utfører økonomiske beregninger
- 2. Vanlig rente
- 3. Rentes rente
- 4. Kontantstrøm (investeringsvurdering)
- 5. Amortisering
- 6. Omregning av rentefot
- 7. Kostnad, salgspris, fortjenestemargin
- 8. Dag-/datoberegninger
- 9. Avskrivning
- 10. Obligasjonsberegninger
- 11. Økonomiske beregninger ved hjelp av funksjoner
- Kapittel 8 Programmering
- 1. Grunnleggende programmeringstrinn
- 2. Funksjonstaster for Program-modus
- 3. Redigere programinnhold
- 4. Filbehandling
- 5. Kommandoreferanse
- 6. Bruke kalkulatorfunksjoner i programmer
- 7. Kommandolisten i Program-modus
- 8. CASIO-kalkulator med vitenskapelige funksjoner Spesialkommandoer <=> Tekstkonverteringstabell
- 9. Programbibliotek
- Kapittel 9 Regneark
- Kapittel 10 eActivity
- Kapittel 11 Minnehåndtering
- Kapittel 12 Systemhåndtering
- Kapittel 13 Datakommunikasjon
- Kapittel 14 Geometri
- Kapittel 15 Picture Plot
- Kapittel 16 3D-graffunksjon
- Kapittel 17 Python (kun fx-CG50, fx-CG50 AU)
- Kapittel 18 Distribusjon (kun fx-CG50, fx-CG50 AU)
- Vedlegg
- Examination Modes
- E-CON4 Application (English)
- 1. E-CON4 Mode Overview
- 2. Sampling Screen
- 3. Auto Sensor Detection (CLAB Only)
- 4. Selecting a Sensor
- 5. Configuring the Sampling Setup
- 6. Performing Auto Sensor Calibration and Zero Adjustment
- 7. Using a Custom Probe
- 8. Using Setup Memory
- 9. Starting a Sampling Operation
- 10. Using Sample Data Memory
- 11. Using the Graph Analysis Tools to Graph Data
- 12. Graph Analysis Tool Graph Screen Operations
- 13. Calling E-CON4 Functions from an eActivity

ε-46
Graph Analysis Tool Graph Screen Operations
4. Move the trace pointer to the end point of the range for which you want to perform
quadratic regression, and then press w.
• This displays the quadratic regression calculation
result screen.
5. Press 6(DRAW).
• This draws a quadratic regression graph and
overlays it over the original graph.
• To delete the overlaid quadratic regression graph,
press !4(SKETCH) and then 1(Cls).
k Overlaying a Y=f(x) Graph on a Sampled Result Graph
You can use the E-CON4 mode to graph equations based on the form Y=f(x). From the
graph screen, press K5(Y=fx) to display the graph relation list screen. From there,
operations are identical to those in the Graph mode.
Note
• The data on the graph relation list screen is shared with the Graph mode. Note, however,
that only Y= type graphs can be used in the E-CON4 mode. Because of this, calling up
the graph relation list screen from the E-CON4 mode will display a “Y” (Y= type) item for
function menu key 3. Also, 5(MODIFY) is not displayed, because it is not used in the
E-CON4 mode.
k Working with Multiple Graphs (Not included on the Manual Sampling)
The procedures in this section explain how you can zoom or move a particular graph when
there are multiple graphs on the display.
• To zoom a particular graph on a multi-graph display
1. When the graph screen contains multiple graphs, press K, and then 3(EDIT).
• The EDIT menu appears at the bottom of the display.