
User Manual
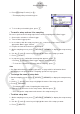
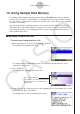
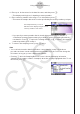
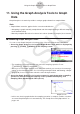
Table Of Contents
- Innhold
- Bli kjent – Les dette først!
- Kapittel 1 Grunnleggende bruk
- Kapittel 2 Manuelle beregninger
- 1. Grunnleggende beregninger
- 2. Spesialfunksjoner
- 3. Angi vinkelenhet og displayformat
- 4. Funksjonsberegninger
- 5. Numeriske beregninger
- 6. Beregninger med komplekse tall
- 7. Binære, oktale, desimale og heksadesimale heltallsberegninger
- 8. Matriseberegninger
- 9. Vektorberegninger
- 10. Metriske omformingsberegninger
- Kapittel 3 Listefunksjon
- Kapittel 4 Likningsberegninger
- Kapittel 5 Graftegning
- 1. Eksempelgrafer
- 2. Bestemme hva som skal vises på et grafskjermbilde
- 3. Tegne en graf
- 4. Lagre og hente frem innholdet av grafskjermbildet
- 5. Tegne to grafer på samme skjerm
- 6. Manuell graftegning
- 7. Bruke tabeller
- 8. Endre en graf
- 9. Dynamisk grafskriving
- 10. Tegne graf for en rekursjonsformel
- 11. Tegne kjeglesnitt som graf
- 12. Tegning av punkter, linjer og tekst på grafskjermen (Skisse)
- 13. Funksjonsanalyse
- Kapittel 6 Statistiske grafer og beregninger
- 1. Før du utfører statistiske beregninger
- 2. Beregne og tegne grafer for statistiske data med én variabel
- 3. Beregne og tegne grafer for statistiske data med parvise variabler (kurve montering)
- 4. Utføre statistiske beregninger
- 5. Tester
- 6. Konfidensintervall
- 7. Distribusjon
- 8. Inntastings- og utdataledd for tester, konfidensintervall og distribusjon
- 9. Statistisk formel
- Kapittel 7 Økonomiske beregninger
- 1. Før du utfører økonomiske beregninger
- 2. Vanlig rente
- 3. Rentes rente
- 4. Kontantstrøm (investeringsvurdering)
- 5. Amortisering
- 6. Omregning av rentefot
- 7. Kostnad, salgspris, fortjenestemargin
- 8. Dag-/datoberegninger
- 9. Avskrivning
- 10. Obligasjonsberegninger
- 11. Økonomiske beregninger ved hjelp av funksjoner
- Kapittel 8 Programmering
- 1. Grunnleggende programmeringstrinn
- 2. Funksjonstaster for Program-modus
- 3. Redigere programinnhold
- 4. Filbehandling
- 5. Kommandoreferanse
- 6. Bruke kalkulatorfunksjoner i programmer
- 7. Kommandolisten i Program-modus
- 8. CASIO-kalkulator med vitenskapelige funksjoner Spesialkommandoer <=> Tekstkonverteringstabell
- 9. Programbibliotek
- Kapittel 9 Regneark
- Kapittel 10 eActivity
- Kapittel 11 Minnehåndtering
- Kapittel 12 Systemhåndtering
- Kapittel 13 Datakommunikasjon
- Kapittel 14 Geometri
- Kapittel 15 Picture Plot
- Kapittel 16 3D-graffunksjon
- Kapittel 17 Python (kun fx-CG50, fx-CG50 AU)
- Kapittel 18 Distribusjon (kun fx-CG50, fx-CG50 AU)
- Vedlegg
- Examination Modes
- E-CON4 Application (English)
- 1. E-CON4 Mode Overview
- 2. Sampling Screen
- 3. Auto Sensor Detection (CLAB Only)
- 4. Selecting a Sensor
- 5. Configuring the Sampling Setup
- 6. Performing Auto Sensor Calibration and Zero Adjustment
- 7. Using a Custom Probe
- 8. Using Setup Memory
- 9. Starting a Sampling Operation
- 10. Using Sample Data Memory
- 11. Using the Graph Analysis Tools to Graph Data
- 12. Graph Analysis Tool Graph Screen Operations
- 13. Calling E-CON4 Functions from an eActivity

ε-32
Starting a Sampling Operation
• You can sample data up to 100 times.
7. To exit the sampling operation, press J.
• This displays an exit confirmation dialog box.
8. Press 1(Yes).
• This displays a screen like the one shown below.
• Specify the list where you want to store the data.
Input ... Specify the list where you want to store the horizontal axis data.
CH1, CH2, CH3 ... Specify lists where you want to store the sample data of each
channel.
9. After specifying the lists, press w.
• This will cause the message “Complete!” to appear. To return to the Manual Sampling
screen, press w.
• In the Statistics mode, sample data will be displayed as shown below.
Note
• You can use trace while sampled data is shown on the graph. For details, see “Using
Trace” (page ε-40).
• If “On” is selected for the sampling “Time Limit” setting, sampling will stop automatically if
you do not perform any operation for 90 minutes. In this case, the sample data is not stored
in a list.