
User Manual
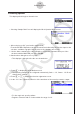
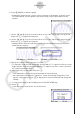
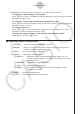
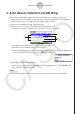
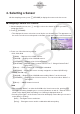
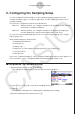
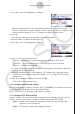
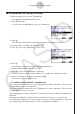
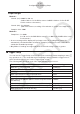
Table Of Contents
- Innhold
- Bli kjent – Les dette først!
- Kapittel 1 Grunnleggende bruk
- Kapittel 2 Manuelle beregninger
- 1. Grunnleggende beregninger
- 2. Spesialfunksjoner
- 3. Angi vinkelenhet og displayformat
- 4. Funksjonsberegninger
- 5. Numeriske beregninger
- 6. Beregninger med komplekse tall
- 7. Binære, oktale, desimale og heksadesimale heltallsberegninger
- 8. Matriseberegninger
- 9. Vektorberegninger
- 10. Metriske omformingsberegninger
- Kapittel 3 Listefunksjon
- Kapittel 4 Likningsberegninger
- Kapittel 5 Graftegning
- 1. Eksempelgrafer
- 2. Bestemme hva som skal vises på et grafskjermbilde
- 3. Tegne en graf
- 4. Lagre og hente frem innholdet av grafskjermbildet
- 5. Tegne to grafer på samme skjerm
- 6. Manuell graftegning
- 7. Bruke tabeller
- 8. Endre en graf
- 9. Dynamisk grafskriving
- 10. Tegne graf for en rekursjonsformel
- 11. Tegne kjeglesnitt som graf
- 12. Tegning av punkter, linjer og tekst på grafskjermen (Skisse)
- 13. Funksjonsanalyse
- Kapittel 6 Statistiske grafer og beregninger
- 1. Før du utfører statistiske beregninger
- 2. Beregne og tegne grafer for statistiske data med én variabel
- 3. Beregne og tegne grafer for statistiske data med parvise variabler (kurve montering)
- 4. Utføre statistiske beregninger
- 5. Tester
- 6. Konfidensintervall
- 7. Distribusjon
- 8. Inntastings- og utdataledd for tester, konfidensintervall og distribusjon
- 9. Statistisk formel
- Kapittel 7 Økonomiske beregninger
- 1. Før du utfører økonomiske beregninger
- 2. Vanlig rente
- 3. Rentes rente
- 4. Kontantstrøm (investeringsvurdering)
- 5. Amortisering
- 6. Omregning av rentefot
- 7. Kostnad, salgspris, fortjenestemargin
- 8. Dag-/datoberegninger
- 9. Avskrivning
- 10. Obligasjonsberegninger
- 11. Økonomiske beregninger ved hjelp av funksjoner
- Kapittel 8 Programmering
- 1. Grunnleggende programmeringstrinn
- 2. Funksjonstaster for Program-modus
- 3. Redigere programinnhold
- 4. Filbehandling
- 5. Kommandoreferanse
- 6. Bruke kalkulatorfunksjoner i programmer
- 7. Kommandolisten i Program-modus
- 8. CASIO-kalkulator med vitenskapelige funksjoner Spesialkommandoer <=> Tekstkonverteringstabell
- 9. Programbibliotek
- Kapittel 9 Regneark
- Kapittel 10 eActivity
- Kapittel 11 Minnehåndtering
- Kapittel 12 Systemhåndtering
- Kapittel 13 Datakommunikasjon
- Kapittel 14 Geometri
- Kapittel 15 Picture Plot
- Kapittel 16 3D-graffunksjon
- Kapittel 17 Python (kun fx-CG50, fx-CG50 AU)
- Kapittel 18 Distribusjon (kun fx-CG50, fx-CG50 AU)
- Vedlegg
- Examination Modes
- E-CON4 Application (English)
- 1. E-CON4 Mode Overview
- 2. Sampling Screen
- 3. Auto Sensor Detection (CLAB Only)
- 4. Selecting a Sensor
- 5. Configuring the Sampling Setup
- 6. Performing Auto Sensor Calibration and Zero Adjustment
- 7. Using a Custom Probe
- 8. Using Setup Memory
- 9. Starting a Sampling Operation
- 10. Using Sample Data Memory
- 11. Using the Graph Analysis Tools to Graph Data
- 12. Graph Analysis Tool Graph Screen Operations
- 13. Calling E-CON4 Functions from an eActivity

ε-13
Configuring the Sampling Setup
5. Press c to move the highlighting to “Samples”.
• When the sampling mode is “Periodic Sampling” and a CMA or Vernier Photogate
Pulley is assigned to the channel, “Distance” will be displayed in place of “Samples”. For
information about “Distance”, see “To configure the Distance setting” below.
6. Press e.
• This displays a dialog box for specifying the number of samples.
7. Input the number of samples and then press w.
8. Press c to move the highlighting to “Warm-up”.
9. Press one of the functions keys below.
1(Auto) … Automatically configures warm-up time settings for each sensor.
2(Manual) … Select for manual input of the warm-up time in seconds units.
3(None) … Disables warm-up time.
• Pressing 2(Manual) displays a dialog box for specifying the warm-up time. Input the
warm-up time and then press w.
• When the sampling mode is “Fast Sampling”, “FFT Graph” will be displayed in place
of “Warm-up”. For information about “FFT Graph”, see “To configure the FFT Graph
setting” below.
10. After all of settings are the way you want, press J.
• This returns to the sampling screen.
u To configure the Distance setting
Move the highlighting to “Distance” and then press 1(NUMBER). This displays a dialog box
for specifying the drop distance for the smart pulley weight.
Input a value from 0.1 to 4.0 to specify the distance in meters.
u To configure FFT Graph setting
In place of step 9 of the procedure under “Using Method 1 to Configure Settings”, specify
whether or not you want to draw a frequency characteristics graph (FFT Graph).
1(On) ... Draws an FFT graph after sampling is finished. Use the dialog box that
appears to select a frequency.
2(Off) ... FFT Graph no drawn after sampling is finished.