
User Manual
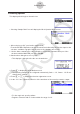
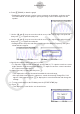
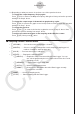
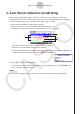
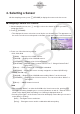
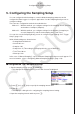
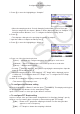
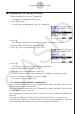
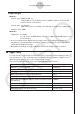
Table Of Contents
- Inhoud
- Eerste kennismaking — Lees dit eerst!
- Hoofdstuk 1 Basisbewerking
- Hoofdstuk 2 Handmatige berekeningen
- 1. Basisberekeningen
- 2. Speciale functies
- 3. De hoekeenheid en weergave van getallen instellen
- 4. Functieberekeningen
- 5. Numerieke berekeningen
- 6. Rekenen met complexe getallen
- 7. Berekeningen met gehele getallen in het twee-, acht-, tien- en zestientallige talstelsel
- 8. Matrixberekeningen
- 9. Vectorberekeningen
- 10. Metrieke omzetting
- Hoofdstuk 3 Lijsten
- Hoofdstuk 4 Vergelijkingen berekenen
- Hoofdstuk 5 Grafieken tekenen
- 1. Voorbeeldgrafieken
- 2. Bepalen wat wordt weergegeven in een grafiekscherm
- 3. Een grafiek tekenen
- 4. Inhoud van het grafiekscherm opslaan en oproepen
- 5. Twee grafieken in hetzelfde scherm tekenen
- 6. Handmatig tekenen
- 7. Tabellen gebruiken
- 8. Een grafiek wijzigen
- 9. Dynamische grafieken tekenen
- 10. Een grafiek tekenen op basis van een recursieformule
- 11. Grafieken van kegelsneden tekenen
- 12. Punten, lijnen en tekst tekenen in het grafiekscherm (Sketch)
- 13. Functieanalyse
- Hoofdstuk 6 Statistische grafieken en berekeningen
- 1. Voor u met statistische berekeningen begint
- 2. Grafieken en berekeningen voor statistische gegevens met één variabele
- 3. Grafieken en berekeningen voor statistische gegevens met twee variabelen (Aanpassing kromme)
- 4. Statistische berekeningen uitvoeren
- 5. Testen
- 6. Betrouwbaarheidsinterval
- 7. Kansverdelingsfuncties
- 8. Invoer- en uitvoertermen van testen, betrouwbaarheidsinterval en kansverdelingsfuncties
- 9. Statistische formule
- Hoofdstuk 7 Financiële berekeningen
- 1. Voor u met financiële berekeningen begint
- 2. Een enkelvoudige interest berekenen
- 3. Een samengestelde interest berekenen
- 4. Evaluatie van een investering (cashflow)
- 5. Afschrijving van een lening
- 6. Omzetting van nominale rentevoet naar reële rentevoet
- 7. Berekening van kosten, verkoopprijs en winstmarge
- 8. Dag- en datumberekeningen
- 9. Devaluatie
- 10. Obligatieberekeningen
- 11. Financiële berekeningen met gebruik van functies
- Hoofdstuk 8 Programmeren
- 1. Basishandelingen voor het programmeren
- 2. Functietoetsen in de modus Program
- 3. De programma-inhoud wijzigen
- 4. Bestandsbeheer
- 5. Overzicht van de opdrachten
- 6. Rekenmachinefuncties gebruiken bij het programmeren
- 7. Lijst met opdrachten in de modus Program
- 8. Wetenschappelijke CASIO-specifieke functieopdrachten <=> Tekstconversietabel
- 9. Programmablad
- Hoofdstuk 9 Spreadsheet
- Hoofdstuk 10 eActivity
- Hoofdstuk 11 Geheugenbeheer
- Hoofdstuk 12 Systeembeheer
- Hoofdstuk 13 Gegevenscommunicatie
- Hoofdstuk 14 Geometry
- Hoofdstuk 15 Picture Plot
- Hoofdstuk 16 3D-grafiek functie
- Hoofdstuk 17 Python (alleen fx-CG50, fx-CG50 AU)
- Hoofdstuk 18 Kansverdeling (alleen fx-CG50, fx-CG50 AU)
- Bijlage
- Examenmodi
- E-CON4 Application (English)
- 1. E-CON4 Mode Overview
- 2. Sampling Screen
- 3. Auto Sensor Detection (CLAB Only)
- 4. Selecting a Sensor
- 5. Configuring the Sampling Setup
- 6. Performing Auto Sensor Calibration and Zero Adjustment
- 7. Using a Custom Probe
- 8. Using Setup Memory
- 9. Starting a Sampling Operation
- 10. Using Sample Data Memory
- 11. Using the Graph Analysis Tools to Graph Data
- 12. Graph Analysis Tool Graph Screen Operations
- 13. Calling E-CON4 Functions from an eActivity

ε-13
Configuring the Sampling Setup
5. Press c to move the highlighting to “Samples”.
• When the sampling mode is “Periodic Sampling” and a CMA or Vernier Photogate
Pulley is assigned to the channel, “Distance” will be displayed in place of “Samples”. For
information about “Distance”, see “To configure the Distance setting” below.
6. Press e.
• This displays a dialog box for specifying the number of samples.
7. Input the number of samples and then press w.
8. Press c to move the highlighting to “Warm-up”.
9. Press one of the functions keys below.
1(Auto) … Automatically configures warm-up time settings for each sensor.
2(Manual) … Select for manual input of the warm-up time in seconds units.
3(None) … Disables warm-up time.
• Pressing 2(Manual) displays a dialog box for specifying the warm-up time. Input the
warm-up time and then press w.
• When the sampling mode is “Fast Sampling”, “FFT Graph” will be displayed in place
of “Warm-up”. For information about “FFT Graph”, see “To configure the FFT Graph
setting” below.
10. After all of settings are the way you want, press J.
• This returns to the sampling screen.
u To configure the Distance setting
Move the highlighting to “Distance” and then press 1(NUMBER). This displays a dialog box
for specifying the drop distance for the smart pulley weight.
Input a value from 0.1 to 4.0 to specify the distance in meters.
u To configure FFT Graph setting
In place of step 9 of the procedure under “Using Method 1 to Configure Settings”, specify
whether or not you want to draw a frequency characteristics graph (FFT Graph).
1(On) ... Draws an FFT graph after sampling is finished. Use the dialog box that
appears to select a frequency.
2(Off) ... FFT Graph no drawn after sampling is finished.