
User Manual
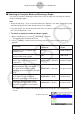
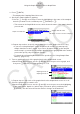


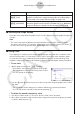

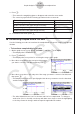
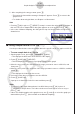
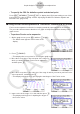
Table Of Contents
- Innehåll
- Komma igång — Läs det här först!
- Kapitel 1 Grundläggande funktioner
- Kapitel 2 Manuella beräkningar
- 1. Grundläggande beräkningar
- 2. Specialfunktioner
- 3. Ange vinkelenhet och visningsformat
- 4. Funktionsberäkningar
- 5. Numeriska beräkningar
- 6. Beräkningar med komplexa tal
- 7. Beräkningar med binär, oktal, decimal och hexadecimal heltalsaritmetik
- 8. Matrisberäkningar
- 9. Vektorberäkningar
- 10. Beräkning av meterkonvertering
- Kapitel 3 Listfunktionen
- Kapitel 4 Ekvationer
- Kapitel 5 Grafritning
- 1. Exempelgrafer
- 2. Kontrollera vad som visas på en grafskärm
- 3. Rita en graf
- 4. Spara och hämta grafskärminnehåll
- 5. Rita två grafer på samma skärm
- 6. Manuella grafer
- 7. Använda tabeller
- 8. Modifiera en graf
- 9. Dynamiska grafer
- 10. Grafer och rekursionsformler
- 11. Rita en graf över ett kägelsnitt
- 12. Rita punkter, linjer och text på grafskärmen (Sketch)
- 13. Funktionsanalys
- Kapitel 6 Statistikgrafer och beräkningar
- 1. Innan du utför statistikberäkningar
- 2. Beräkna och rita graf för statistiska data för en variabel
- 3. Beräkna och rita statistisk data för variabelpar (kurvpassning)
- 4. Utföra statstikberäkningar
- 5. Tester
- 6. Konfidensintervall
- 7. Fördelning
- 8. Inmatnings- och utmatningstermer för test, konfidensintervall och fördelning
- 9. Statistikformel
- Kapitel 7 Ekonomiska beräkningar
- Kapitel 8 Programmering
- 1. Grundläggande programmering
- 2. Funktionstangenter i läget Program
- 3. Redigera programinnehåll
- 4. Filhantering
- 5. Kommandoreferens
- 6. Använda räknarfunktioner i program
- 7. Kommandon i läget Program
- 8. Särskilda kommandon för CASIO-räknare för funktionsvärden <=> textkonverteringstabell
- 9. Programbibliotek
- Kapitel 9 Kalkylblad
- Kapitel 10 eActivity
- Kapitel 11 Minneshanterare
- Kapitel 12 Systemhanterare
- Kapitel 13 Datakommunikation
- Kapitel 14 Geometri
- Kapitel 15 Picture Plot
- Kapitel 16 3D-graffunktion
- Kapitel 17 Python (endast fx-CG50, fx-CG50 AU)
- Kapitel 18 Fördelning (endast fx-CG50, fx-CG50 AU)
- Funktionstangenter i läget Bilaga
- Examinationslägen
- E-CON4 Application (English)
- 1. E-CON4 Mode Overview
- 2. Sampling Screen
- 3. Auto Sensor Detection (CLAB Only)
- 4. Selecting a Sensor
- 5. Configuring the Sampling Setup
- 6. Performing Auto Sensor Calibration and Zero Adjustment
- 7. Using a Custom Probe
- 8. Using Setup Memory
- 9. Starting a Sampling Operation
- 10. Using Sample Data Memory
- 11. Using the Graph Analysis Tools to Graph Data
- 12. Graph Analysis Tool Graph Screen Operations
- 13. Calling E-CON4 Functions from an eActivity

ε-42
Graph Analysis Tool Graph Screen Operations
3. Press w.
• This causes the magnifying glass to disappear and enters the zoom mode.
• The cursor keys perform the following operations in the zoom mode.
To do this: Press this cursor key:
Enlarge the graph image horizontally
e
Reduce the size of the graph image horizontally
d
Enlarge the graph image vertically
f
Reduce the size of the graph image vertically
c
4. To exit the zoom mode, press J.
k Transforming Sampled Data to List Data
Use the following procedure to transform the sampled data in a specific range of a graph into
list data.
• To transform sampled data to list data
1. On the graph screen, press K2(MEMORY), and then 1(LISTMEM).
• This displays the LISTMEM menu.
2. Press 2(SELECT).
• This displays the trace pointer for selecting the range on the graph.
3. Move the trace pointer to the start point of the range
you want to convert to list data, and then press w.
4. Move the trace pointer to the end point of the range you want to convert to list data, and
then press w.
• This displays a dialog box for specifying the lists where you want to store the time data
and the sampled data.
→
• The initial default lists are List 1 for the time and List 2 for sample data. To change to
another list (List 1 to List 26), use the up and down cursor keys to move the highlighting
to the list you want to change, and then input the applicable list number.