
User Manual
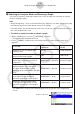
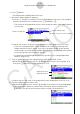
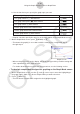
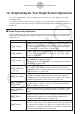
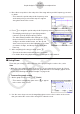
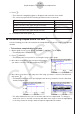
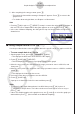
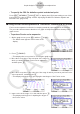

Table Of Contents
- Innhold
- Bli kjent – Les dette først!
- Kapittel 1 Grunnleggende bruk
- Kapittel 2 Manuelle beregninger
- 1. Grunnleggende beregninger
- 2. Spesialfunksjoner
- 3. Angi vinkelenhet og displayformat
- 4. Funksjonsberegninger
- 5. Numeriske beregninger
- 6. Beregninger med komplekse tall
- 7. Binære, oktale, desimale og heksadesimale heltallsberegninger
- 8. Matriseberegninger
- 9. Vektorberegninger
- 10. Metriske omformingsberegninger
- Kapittel 3 Listefunksjon
- Kapittel 4 Likningsberegninger
- Kapittel 5 Graftegning
- 1. Eksempelgrafer
- 2. Bestemme hva som skal vises på et grafskjermbilde
- 3. Tegne en graf
- 4. Lagre og hente frem innholdet av grafskjermbildet
- 5. Tegne to grafer på samme skjerm
- 6. Manuell graftegning
- 7. Bruke tabeller
- 8. Endre en graf
- 9. Dynamisk grafskriving
- 10. Tegne graf for en rekursjonsformel
- 11. Tegne kjeglesnitt som graf
- 12. Tegning av punkter, linjer og tekst på grafskjermen (Skisse)
- 13. Funksjonsanalyse
- Kapittel 6 Statistiske grafer og beregninger
- 1. Før du utfører statistiske beregninger
- 2. Beregne og tegne grafer for statistiske data med én variabel
- 3. Beregne og tegne grafer for statistiske data med parvise variabler (kurve montering)
- 4. Utføre statistiske beregninger
- 5. Tester
- 6. Konfidensintervall
- 7. Distribusjon
- 8. Inntastings- og utdataledd for tester, konfidensintervall og distribusjon
- 9. Statistisk formel
- Kapittel 7 Økonomiske beregninger
- 1. Før du utfører økonomiske beregninger
- 2. Vanlig rente
- 3. Rentes rente
- 4. Kontantstrøm (investeringsvurdering)
- 5. Amortisering
- 6. Omregning av rentefot
- 7. Kostnad, salgspris, fortjenestemargin
- 8. Dag-/datoberegninger
- 9. Avskrivning
- 10. Obligasjonsberegninger
- 11. Økonomiske beregninger ved hjelp av funksjoner
- Kapittel 8 Programmering
- 1. Grunnleggende programmeringstrinn
- 2. Funksjonstaster for Program-modus
- 3. Redigere programinnhold
- 4. Filbehandling
- 5. Kommandoreferanse
- 6. Bruke kalkulatorfunksjoner i programmer
- 7. Kommandolisten i Program-modus
- 8. CASIO-kalkulator med vitenskapelige funksjoner Spesialkommandoer <=> Tekstkonverteringstabell
- 9. Programbibliotek
- Kapittel 9 Regneark
- Kapittel 10 eActivity
- Kapittel 11 Minnehåndtering
- Kapittel 12 Systemhåndtering
- Kapittel 13 Datakommunikasjon
- Kapittel 14 Geometri
- Kapittel 15 Picture Plot
- Kapittel 16 3D-graffunksjon
- Kapittel 17 Python (kun fx-CG50, fx-CG50 AU)
- Kapittel 18 Distribusjon (kun fx-CG50, fx-CG50 AU)
- Vedlegg
- Examination Modes
- E-CON4 Application (English)
- 1. E-CON4 Mode Overview
- 2. Sampling Screen
- 3. Auto Sensor Detection (CLAB Only)
- 4. Selecting a Sensor
- 5. Configuring the Sampling Setup
- 6. Performing Auto Sensor Calibration and Zero Adjustment
- 7. Using a Custom Probe
- 8. Using Setup Memory
- 9. Starting a Sampling Operation
- 10. Using Sample Data Memory
- 11. Using the Graph Analysis Tools to Graph Data
- 12. Graph Analysis Tool Graph Screen Operations
- 13. Calling E-CON4 Functions from an eActivity

ε-37
Using the Graph Analysis Tools to Graph Data
3. Press 2(DATA).
• This displays the Sampling Data List screen.
4. Specify the sampled data for graphing.
a. Use the f and c cursor keys to move the highlighting to the name of the sampled
data file you want to select, and then press 1(ASSIGN) or w.
• This returns to the Graph Mode screen, which shows the name of the sample data file
you selected.
Graph on/off indicator
Sample data file name
Name of sensor used for sampling
Graph Mode Screen
b. Repeat step a above to specify sample data files for other graphs, if there are any.
• If you select “Graph Analysis” as the analysis mode in step 2, you must specify
sample data files for three graphs. If you select “Compare Graph” as the analysis
mode in step 2, you must specify sample data files for two graphs. With other modes,
you need to specify only one sample data file.
• For details about Sampling Data List screen operations, see “Using Sample Data
Memory” (page
ε-33).
5. Turn on graphing for each of the graphs listed on the Graph Mode screen.
a. On the Graph Mode screen, use the f and c cursor keys to select a graph, and
then press 1(SELECT) to toggle graphing on or off.
Graphing turned off.
Graphing turned on.
b. Repeat step a to turn each of the graphs listed on the Graph Mode screen on or off.
6. Select the graph style you want to use.
a. On the Graph Mode screen, use the f and c cursor keys to move the highlighting
to the graph (Gph1, Gph2, etc.) whose style you want to specify, and then press
4(STYLE). This will cause the function menu to change as shown below.